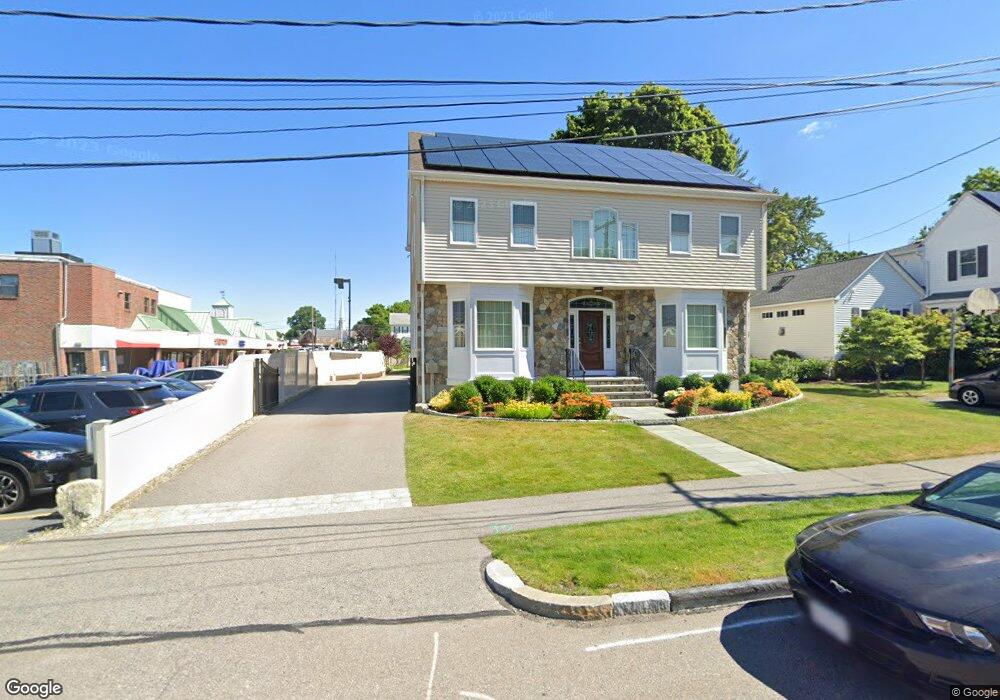
53 Mellen St Needham Heights, MA 02494
Estimated Value: $1,245,000 - $2,147,000
3
Beds
1
Bath
1,337
Sq Ft
$1,280/Sq Ft
Est. Value
About This Home
This home is located at 53 Mellen St, Needham Heights, MA 02494 and is currently estimated at $1,711,838, approximately $1,280 per square foot. 53 Mellen St is a home located in Norfolk County with nearby schools including Sunita L. Williams Elementary School, High Rock Middle School, and Pollard Middle School.
Ownership History
Date
Name
Owned For
Owner Type
Purchase Details
Closed on
Jan 6, 2009
Sold by
Condrin William M and Dugdale Ann J
Bought by
Rrapi Ardian and Rrapi Estela
Current Estimated Value
Home Financials for this Owner
Home Financials are based on the most recent Mortgage that was taken out on this home.
Original Mortgage
$650,000
Outstanding Balance
$430,186
Interest Rate
6.08%
Mortgage Type
Purchase Money Mortgage
Estimated Equity
$1,281,652
Create a Home Valuation Report for This Property
The Home Valuation Report is an in-depth analysis detailing your home's value as well as a comparison with similar homes in the area
Home Values in the Area
Average Home Value in this Area
Purchase History
| Date | Buyer | Sale Price | Title Company |
|---|---|---|---|
| Rrapi Ardian | $350,000 | -- |
Source: Public Records
Mortgage History
| Date | Status | Borrower | Loan Amount |
|---|---|---|---|
| Open | Rrapi Ardian | $650,000 |
Source: Public Records
Tax History
| Year | Tax Paid | Tax Assessment Tax Assessment Total Assessment is a certain percentage of the fair market value that is determined by local assessors to be the total taxable value of land and additions on the property. | Land | Improvement |
|---|---|---|---|---|
| 2025 | $15,335 | $1,446,700 | $656,300 | $790,400 |
| 2024 | $18,566 | $1,482,900 | $468,800 | $1,014,100 |
| 2023 | $17,607 | $1,350,200 | $468,800 | $881,400 |
| 2022 | $16,767 | $1,254,100 | $411,300 | $842,800 |
| 2021 | $16,341 | $1,254,100 | $411,300 | $842,800 |
| 2020 | $15,431 | $1,235,500 | $411,200 | $824,300 |
| 2019 | $14,701 | $1,186,500 | $373,800 | $812,700 |
| 2018 | $14,096 | $1,186,500 | $373,800 | $812,700 |
| 2017 | $12,830 | $1,079,100 | $373,800 | $705,300 |
| 2016 | $12,387 | $1,073,400 | $373,800 | $699,600 |
| 2015 | $12,119 | $1,073,400 | $373,800 | $699,600 |
| 2014 | $10,301 | $885,000 | $339,900 | $545,100 |
Source: Public Records
Map
Nearby Homes
- 445 Hillside Ave
- 40 High St
- 3 Crescent Rd
- 100 Rosemary Way Unit 129
- 100 Rosemary Way Unit 324
- 400 Hunnewell St Unit 103
- 379 Hunnewell St Unit 379
- 132 Hillside Ave
- 140 Hillside Ave
- 140 Hillside Ave Unit a
- 638 Webster St
- 638 Webster St Unit 638
- 34 Pershing Rd
- 19 Highland Ct Unit 19
- 11 Shirley Rd
- 5 Hazel Ln
- 143 Hunting Rd
- 168 Richdale Rd
- 193 Garden St
- 62 Evelyn Rd