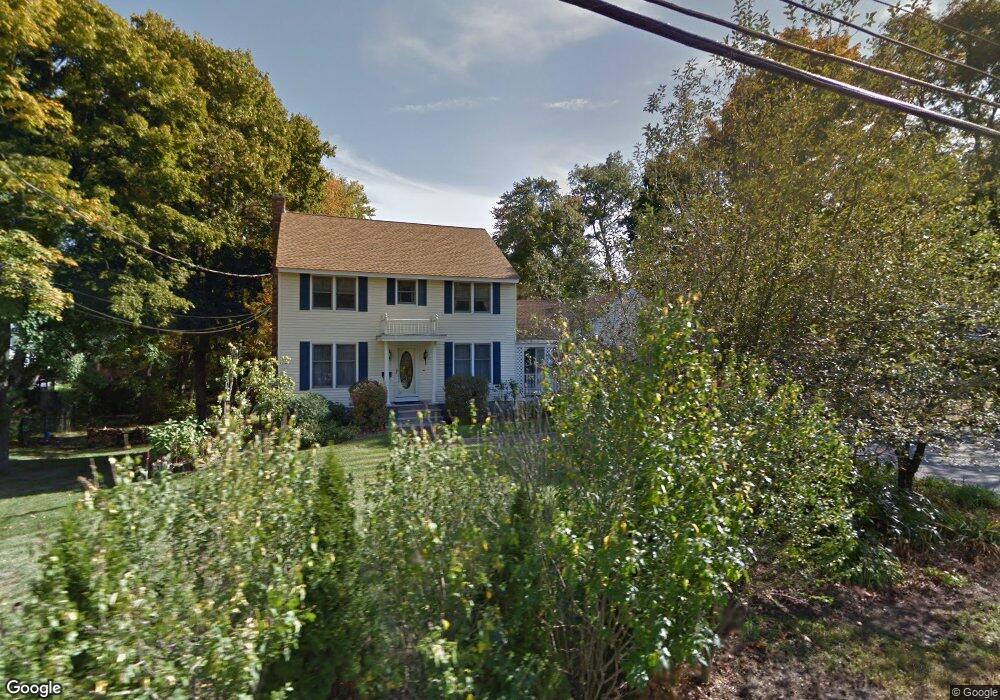
53 Middlesex Ave Wilmington, MA 01887
Estimated Value: $898,954 - $1,098,000
4
Beds
3
Baths
2,892
Sq Ft
$334/Sq Ft
Est. Value
About This Home
This home is located at 53 Middlesex Ave, Wilmington, MA 01887 and is currently estimated at $964,989, approximately $333 per square foot. 53 Middlesex Ave is a home located in Middlesex County with nearby schools including Wilmington Middle School, Wilmington High School, and Abundant Life Christian School and Childcare.
Ownership History
Date
Name
Owned For
Owner Type
Purchase Details
Closed on
Mar 12, 2021
Sold by
Torrisi Lt and Torrisi
Bought by
Torrisi Keith A and Torrisi Fabiana S
Current Estimated Value
Home Financials for this Owner
Home Financials are based on the most recent Mortgage that was taken out on this home.
Original Mortgage
$334,500
Interest Rate
3.05%
Mortgage Type
New Conventional
Purchase Details
Closed on
Feb 10, 2020
Sold by
Torrisi Keith A
Bought by
Torrisi Lt
Purchase Details
Closed on
May 23, 2003
Sold by
Peters Ada M and Peters Mark S
Bought by
Torrisi Katherine A and Torrisi Keith A
Purchase Details
Closed on
Oct 29, 1987
Sold by
Peters Ada M
Bought by
Peters Mark S
Create a Home Valuation Report for This Property
The Home Valuation Report is an in-depth analysis detailing your home's value as well as a comparison with similar homes in the area
Purchase History
| Date | Buyer | Sale Price | Title Company |
|---|---|---|---|
| Torrisi Keith A | -- | None Available | |
| Torrisi Lt | -- | None Available | |
| Torrisi Keith A | -- | None Available | |
| Torrisi Lt | -- | None Available | |
| Torrisi Katherine A | $449,900 | -- | |
| Torrisi Katherine A | $449,900 | -- | |
| Torrisi Katherine A | $449,900 | -- | |
| Peters Mark S | $60,000 | -- |
Source: Public Records
Mortgage History
| Date | Status | Borrower | Loan Amount |
|---|---|---|---|
| Previous Owner | Torrisi Keith A | $334,500 | |
| Previous Owner | Peters Mark S | $259,000 | |
| Previous Owner | Peters Mark S | $253,000 |
Source: Public Records
Tax History
| Year | Tax Paid | Tax Assessment Tax Assessment Total Assessment is a certain percentage of the fair market value that is determined by local assessors to be the total taxable value of land and additions on the property. | Land | Improvement |
|---|---|---|---|---|
| 2025 | $9,533 | $832,600 | $286,000 | $546,600 |
| 2024 | $9,328 | $816,100 | $286,000 | $530,100 |
| 2023 | $8,701 | $728,700 | $259,900 | $468,800 |
| 2022 | $8,150 | $625,500 | $216,600 | $408,900 |
| 2021 | $8,141 | $588,200 | $196,900 | $391,300 |
| 2020 | $7,868 | $579,400 | $196,900 | $382,500 |
| 2019 | $7,688 | $559,100 | $187,600 | $371,500 |
| 2018 | $7,541 | $523,300 | $178,600 | $344,700 |
| 2017 | $7,422 | $513,600 | $178,600 | $335,000 |
| 2016 | $6,908 | $472,200 | $170,100 | $302,100 |
| 2015 | $6,640 | $462,100 | $170,100 | $292,000 |
| 2014 | $6,318 | $443,700 | $162,000 | $281,700 |
Source: Public Records
Map
Nearby Homes
- 3 Clark Terrace
- 31 Burlington Ave
- 9 Parker St
- 7 Cross St Unit 303
- 7 Cross St Unit 304
- 7 Cross St Unit 205
- 7 Cross St Unit 102
- 3 Molloy Rd
- 6 Patricia Cir
- 12 Hamlin Ln
- 224 Burlington Ave
- 15 Mystic Ave
- 56 Grove Ave
- 584 Woburn St
- 255 Burlington Ave
- 203 Lowell St Unit 316
- 203 Lowell St Unit 218
- 203 Lowell St Unit 120
- 21 Marcia Rd
- 50 Glenwood Rd
- 50 Middlesex Ave
- 47 Middlesex Ave
- 58 Middlesex Ave
- 59 Middlesex Ave
- 46 Middlesex Ave
- 95 Clark St
- 42 Middlesex Ave
- 73 Clark St
- 63 Middlesex Ave
- 82 Clark St
- 40 Middlesex Ave
- 66 Middlesex Ave
- 97 Clark St
- 88 Clark St
- 74 Clark St
- 100 Clark St
- 69 Middlesex Ave
- 71 Clark St
- 36 Middlesex Ave Unit Suite 1
- 36 Middlesex Ave Unit A12
Your Personal Tour Guide
Ask me questions while you tour the home.