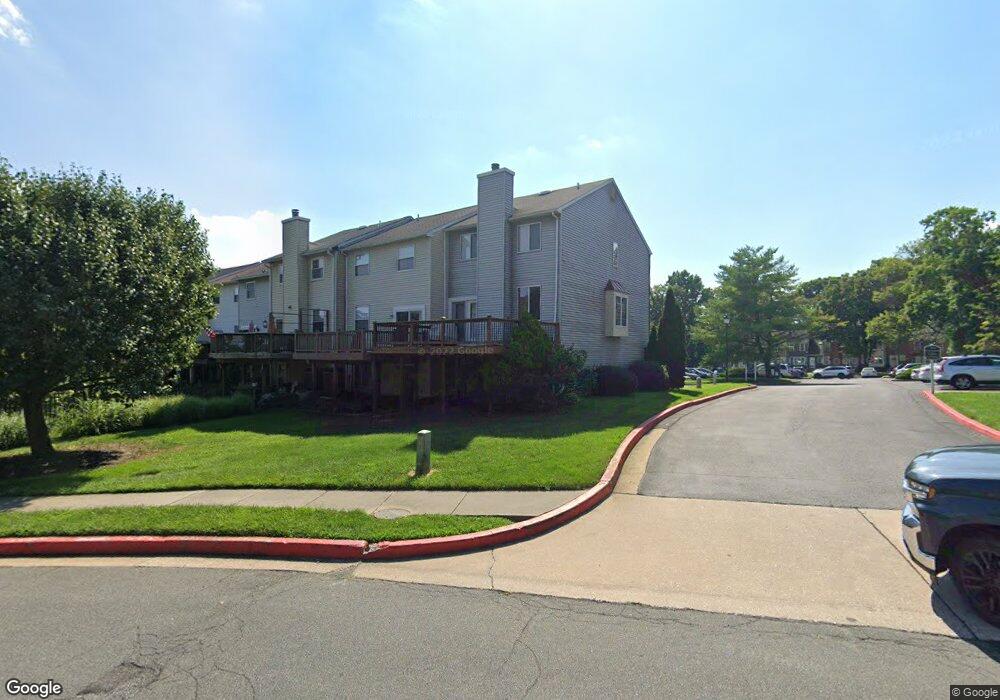
53 Millbridge Ct Nottingham, MD 21236
Estimated Value: $264,210 - $324,000
--
Bed
2
Baths
1,150
Sq Ft
$259/Sq Ft
Est. Value
About This Home
This home is located at 53 Millbridge Ct, Nottingham, MD 21236 and is currently estimated at $297,553, approximately $258 per square foot. 53 Millbridge Ct is a home located in Baltimore County with nearby schools including Joppa View Elementary School, Perry Hall Middle School, and Perry Hall High School.
Ownership History
Date
Name
Owned For
Owner Type
Purchase Details
Closed on
Jul 25, 2016
Sold by
Clarke William E and Thompson Ruth J
Bought by
Thompson Ruth J
Current Estimated Value
Home Financials for this Owner
Home Financials are based on the most recent Mortgage that was taken out on this home.
Original Mortgage
$140,000
Outstanding Balance
$64,253
Interest Rate
3.56%
Mortgage Type
New Conventional
Estimated Equity
$233,300
Purchase Details
Closed on
May 27, 1987
Sold by
Wilson Charles W
Bought by
Clarke William E and Thompson Ruth J
Create a Home Valuation Report for This Property
The Home Valuation Report is an in-depth analysis detailing your home's value as well as a comparison with similar homes in the area
Home Values in the Area
Average Home Value in this Area
Purchase History
| Date | Buyer | Sale Price | Title Company |
|---|---|---|---|
| Thompson Ruth J | -- | Colony Title Group Ltd | |
| Clarke William E | $81,000 | -- |
Source: Public Records
Mortgage History
| Date | Status | Borrower | Loan Amount |
|---|---|---|---|
| Open | Thompson Ruth J | $140,000 |
Source: Public Records
Tax History Compared to Growth
Tax History
| Year | Tax Paid | Tax Assessment Tax Assessment Total Assessment is a certain percentage of the fair market value that is determined by local assessors to be the total taxable value of land and additions on the property. | Land | Improvement |
|---|---|---|---|---|
| 2025 | $3,642 | $221,333 | -- | -- |
| 2024 | $3,642 | $207,267 | $0 | $0 |
| 2023 | $1,718 | $193,200 | $64,000 | $129,200 |
| 2022 | $3,315 | $188,667 | $0 | $0 |
| 2021 | $3,193 | $184,133 | $0 | $0 |
| 2020 | $3,193 | $179,600 | $64,000 | $115,600 |
| 2019 | $3,174 | $179,600 | $64,000 | $115,600 |
| 2018 | $3,137 | $179,600 | $64,000 | $115,600 |
| 2017 | $3,030 | $181,400 | $0 | $0 |
| 2016 | $2,256 | $169,533 | $0 | $0 |
| 2015 | $2,256 | $157,667 | $0 | $0 |
| 2014 | $2,256 | $145,800 | $0 | $0 |
Source: Public Records
Map
Nearby Homes
- 38 Trailwood Rd
- 8382 Cypress Mill Rd
- 25 Stillwood Cir
- 22 Hobb Ct
- 41 Laurel Path Ct
- 9 Bartley Ct
- Lafayette Plan at Villages of White Marsh - Townhomes
- Hampshire Plan at Villages of White Marsh
- Summit Plan at Villages of White Marsh
- Hadley Plan at Villages of White Marsh
- Avalon II Plan at Magnolia Hill
- Seagrove II Plan at Magnolia Hill
- 4808 Grandiflora Cir
- 4810 Grandiflora Cir
- 4812 Grandiflora Cir
- 4814 Grandiflora Cir
- 4803 Grandiflora Cir
- 000 Grandiflora Cir
- 4816 Grandiflora Cir
- 4805 Grandiflora Cir
- 51 Millbridge Ct
- 55 Millbridge Ct
- 49 Millbridge Ct
- 47 Millbridge Ct
- 57 Millbridge Ct
- 65 Millbridge Ct
- 45 Millbridge Ct
- 59 Millbridge Ct
- 61 Millbridge Ct
- 63 Millbridge Ct
- 11 Millbridge Ct
- 7R Millbridge Ct
- 7 Millbridge Ct
- 5 Millbridge Ct
- 41 Millbridge Ct
- 39 Millbridge Ct
- 42 Millbridge Ct
- 3 Millbridge Ct
- 37 Millbridge Ct
- 40 Millbridge Ct