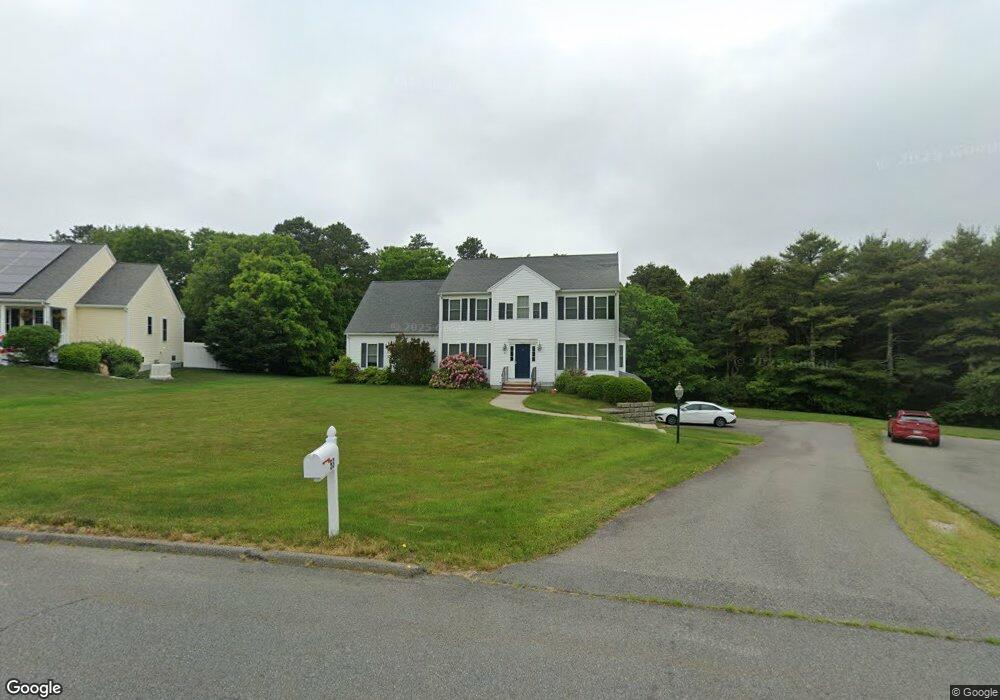
53 Mirasol Dr Bourne, MA 2532
Estimated Value: $766,000 - $852,000
4
Beds
3
Baths
2,772
Sq Ft
$292/Sq Ft
Est. Value
About This Home
This home is located at 53 Mirasol Dr, Bourne, MA 2532 and is currently estimated at $809,406, approximately $291 per square foot. 53 Mirasol Dr is a home located in Barnstable County with nearby schools including Bourne High School and St Margaret Regional School.
Ownership History
Date
Name
Owned For
Owner Type
Purchase Details
Closed on
Aug 2, 2010
Sold by
Pilgrim Pines Ld Llc and Hebb
Bought by
Luecke Jann Hendrik and Owzar Kiani
Current Estimated Value
Home Financials for this Owner
Home Financials are based on the most recent Mortgage that was taken out on this home.
Original Mortgage
$415,552
Outstanding Balance
$270,471
Interest Rate
4.78%
Mortgage Type
Purchase Money Mortgage
Estimated Equity
$538,936
Create a Home Valuation Report for This Property
The Home Valuation Report is an in-depth analysis detailing your home's value as well as a comparison with similar homes in the area
Purchase History
We collect this data history from publicly available records. To have your information removed, we recommend requesting removal directly through your county’s website.
| Date | Buyer | Sale Price | Title Company |
|---|---|---|---|
| Luecke Jann Hendrik | $429,900 | -- | |
| Luecke Jann Hendrik | $429,900 | -- | |
| Pilgrim Pines Ld Llc | $15,458 | -- |
Source: Public Records
Mortgage History
We collect this data history from publicly available records. To have your information removed, we recommend requesting removal directly through your county’s website.
| Date | Status | Borrower | Loan Amount |
|---|---|---|---|
| Open | Luecke Jann Hendrik | $415,552 | |
| Closed | Luecke Jann Hendrik | $415,552 |
Source: Public Records
Tax History
| Year | Tax Paid | Tax Assessment Tax Assessment Total Assessment is a certain percentage of the fair market value that is determined by local assessors to be the total taxable value of land and additions on the property. | Land | Improvement |
|---|---|---|---|---|
| 2025 | $6,069 | $777,100 | $250,800 | $526,300 |
| 2024 | $5,978 | $745,400 | $238,800 | $506,600 |
| 2023 | $6,024 | $683,800 | $230,600 | $453,200 |
| 2022 | $5,727 | $567,600 | $204,100 | $363,500 |
| 2021 | $5,603 | $520,200 | $185,700 | $334,500 |
| 2020 | $5,446 | $507,100 | $183,900 | $323,200 |
| 2019 | $5,172 | $492,100 | $183,900 | $308,200 |
| 2018 | $4,973 | $471,800 | $175,200 | $296,600 |
| 2017 | $4,769 | $463,000 | $166,300 | $296,700 |
| 2016 | $4,445 | $437,500 | $151,900 | $285,600 |
| 2015 | $4,332 | $430,200 | $144,600 | $285,600 |
Source: Public Records
Map
Nearby Homes
- 40 Mirasol Dr
- 40 Mirasol Dr
- 20 Settlers Way
- 100 Bournedale Rd
- 33 Head of The Bay Rd
- 9 Fabyan Way
- 65 Lewis Point Rd
- 29 Weather Deck Rd
- 6 Honora Ln
- 5 Honora Ln Unit 5
- 5 Honora Ln
- 51 Ships View Terrace
- 3 Honora Ln Unit 3
- 24 Ships View Terrace
- 9 Blueberry Rd
- 38 Old Bridge Rd
- 32 Everett Rd
- 14 Quamhassett Rd
- 8 Herring Pond Rd
- 6 Aspen Rd Unit 6
Your Personal Tour Guide
Ask me questions while you tour the home.