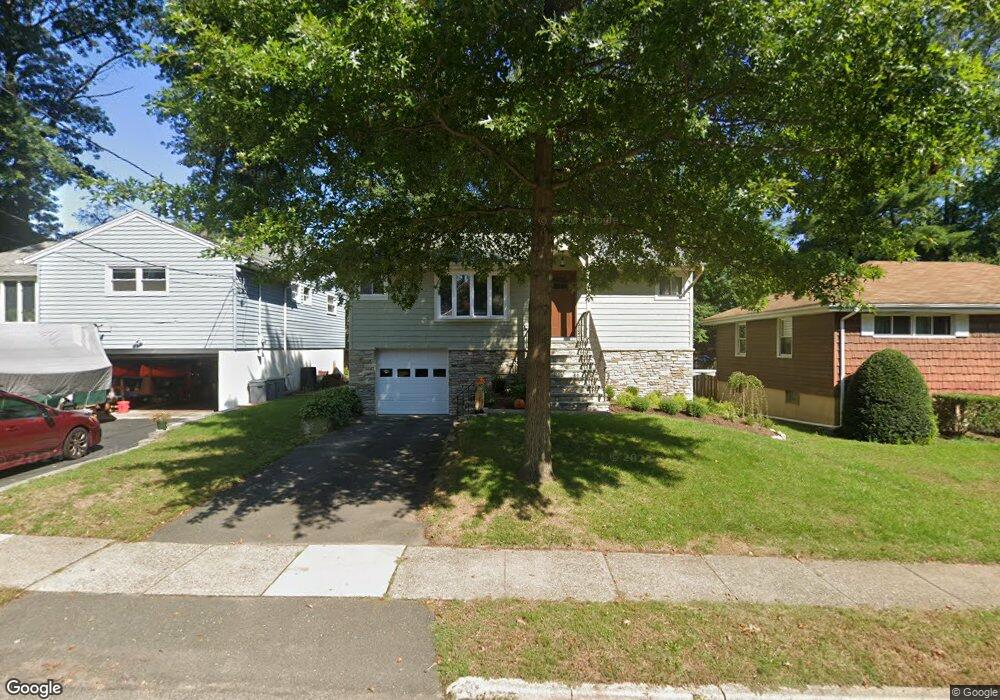
53 Moore Ave Waldwick, NJ 07463
Estimated Value: $492,000 - $565,000
Studio
--
Bath
888
Sq Ft
$604/Sq Ft
Est. Value
About This Home
This home is located at 53 Moore Ave, Waldwick, NJ 07463 and is currently estimated at $536,677, approximately $604 per square foot. 53 Moore Ave is a home located in Bergen County with nearby schools including Waldwick High School, Waldwick Seventh-Day Adventist School, and The Village School - Montessori.
Ownership History
Date
Name
Owned For
Owner Type
Purchase Details
Closed on
Dec 29, 1994
Sold by
Johnson Richard
Bought by
Guild Elise
Current Estimated Value
Home Financials for this Owner
Home Financials are based on the most recent Mortgage that was taken out on this home.
Original Mortgage
$100,000
Interest Rate
9.23%
Purchase Details
Closed on
Oct 30, 1993
Sold by
Lazo Eugene and Lazo Bonnie
Bought by
Johnson Richard and Johnson Petra
Home Financials for this Owner
Home Financials are based on the most recent Mortgage that was taken out on this home.
Original Mortgage
$162,000
Interest Rate
6.69%
Create a Home Valuation Report for This Property
The Home Valuation Report is an in-depth analysis detailing your home's value as well as a comparison with similar homes in the area
Home Values in the Area
Average Home Value in this Area
Purchase History
| Date | Buyer | Sale Price | Title Company |
|---|---|---|---|
| Guild Elise | $168,000 | -- | |
| Johnson Richard | $170,000 | -- |
Source: Public Records
Mortgage History
| Date | Status | Borrower | Loan Amount |
|---|---|---|---|
| Closed | Guild Elise | $100,000 | |
| Previous Owner | Johnson Richard | $162,000 |
Source: Public Records
Tax History
| Year | Tax Paid | Tax Assessment Tax Assessment Total Assessment is a certain percentage of the fair market value that is determined by local assessors to be the total taxable value of land and additions on the property. | Land | Improvement |
|---|---|---|---|---|
| 2025 | $9,292 | $419,700 | $270,000 | $149,700 |
| 2024 | $9,442 | $419,700 | $270,000 | $149,700 |
| 2023 | $9,247 | $324,700 | $220,000 | $104,700 |
| 2022 | $9,247 | $324,700 | $220,000 | $104,700 |
| 2021 | $9,068 | $324,700 | $220,000 | $104,700 |
| 2020 | $8,984 | $324,700 | $220,000 | $104,700 |
| 2019 | $8,981 | $324,700 | $220,000 | $104,700 |
| 2018 | $8,699 | $324,700 | $220,000 | $104,700 |
| 2017 | $8,624 | $324,700 | $220,000 | $104,700 |
| 2016 | $8,449 | $324,700 | $220,000 | $104,700 |
| 2015 | $8,351 | $324,700 | $220,000 | $104,700 |
| 2014 | $8,150 | $318,700 | $220,000 | $98,700 |
Source: Public Records
Map
Nearby Homes
Your Personal Tour Guide
Ask me questions while you tour the home.