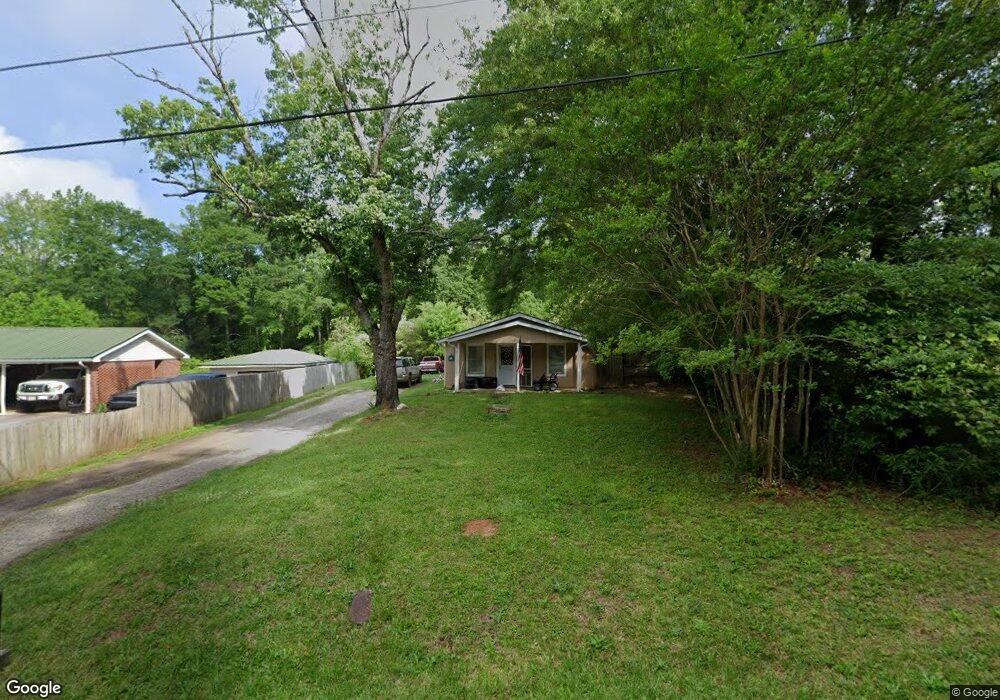
53 Moore St Whitesburg, GA 30185
Estimated Value: $157,916 - $188,000
3
Beds
1
Bath
1,488
Sq Ft
$115/Sq Ft
Est. Value
About This Home
This home is located at 53 Moore St, Whitesburg, GA 30185 and is currently estimated at $171,729, approximately $115 per square foot. 53 Moore St is a home located in Carroll County with nearby schools including Whitesburg Elementary School, Central Middle School, and Central High School.
Ownership History
Date
Name
Owned For
Owner Type
Purchase Details
Closed on
May 26, 2016
Sold by
Federal Home Loan Mortgage Corporation
Bought by
Arnold Martha G
Current Estimated Value
Purchase Details
Closed on
Oct 6, 2015
Sold by
Nationstar Mtg Llc
Bought by
Federal Home Loan Mortgage Corporation
Purchase Details
Closed on
Aug 3, 2007
Sold by
Johnson Ed W
Bought by
Matthews Timothy A
Home Financials for this Owner
Home Financials are based on the most recent Mortgage that was taken out on this home.
Original Mortgage
$70,500
Interest Rate
6.56%
Mortgage Type
New Conventional
Purchase Details
Closed on
Aug 5, 2004
Sold by
Cole Joseph F and Cole Doris
Bought by
Johnson Ed W
Purchase Details
Closed on
Feb 9, 2004
Sold by
Fountaine Max
Bought by
Cole Joseph F and Cole Doris
Purchase Details
Closed on
Sep 7, 1993
Bought by
Fountaine
Purchase Details
Closed on
Jan 14, 1993
Bought by
Fountaine
Create a Home Valuation Report for This Property
The Home Valuation Report is an in-depth analysis detailing your home's value as well as a comparison with similar homes in the area
Home Values in the Area
Average Home Value in this Area
Purchase History
| Date | Buyer | Sale Price | Title Company |
|---|---|---|---|
| Arnold Martha G | $22,000 | -- | |
| Federal Home Loan Mortgage Corporation | -- | -- | |
| Nationstar Mtg Llc | $35,881 | -- | |
| Matthews Timothy A | $70,500 | -- | |
| Johnson Ed W | -- | -- | |
| Cole Joseph F | $13,000 | -- | |
| Fountaine | -- | -- | |
| Fountaine | $20,000 | -- |
Source: Public Records
Mortgage History
| Date | Status | Borrower | Loan Amount |
|---|---|---|---|
| Previous Owner | Matthews Timothy A | $70,500 |
Source: Public Records
Tax History Compared to Growth
Tax History
| Year | Tax Paid | Tax Assessment Tax Assessment Total Assessment is a certain percentage of the fair market value that is determined by local assessors to be the total taxable value of land and additions on the property. | Land | Improvement |
|---|---|---|---|---|
| 2024 | $1,069 | $36,716 | $1,934 | $34,782 |
| 2023 | $1,108 | $46,540 | $4,395 | $42,145 |
| 2022 | $1,190 | $36,716 | $2,930 | $33,786 |
| 2021 | $851 | $25,643 | $1,915 | $23,728 |
| 2020 | $937 | $28,189 | $2,131 | $26,058 |
| 2019 | $905 | $26,830 | $2,131 | $24,699 |
| 2018 | $818 | $23,973 | $1,992 | $21,981 |
| 2017 | $302 | $8,800 | $1,992 | $6,808 |
| 2016 | $701 | $24,021 | $1,992 | $22,029 |
| 2015 | $943 | $26,026 | $4,000 | $22,026 |
| 2014 | $946 | $26,026 | $4,000 | $22,026 |
Source: Public Records
Map
Nearby Homes
- 688 Main St
- 0 Georgia 5 Unit 10539047
- 0 Georgia 5 Unit 105 147845
- 252 Moore St
- 109 Landon Dr
- 2184 Jones Mill Rd
- 0 Georgia 16
- 42 Church Ln
- 15 Bailey St
- 40 Coral Dr
- 226 Long Island Dr
- 0 TRACT 2 Little New York Rd
- 439 Old Jones Rd
- 80 Shannon Rd
- 2241 Georgia 16
- 46 Stapler Rd
- 46 Helen Ct
- 212 Teepee Trail
- 2116 Jones Mill Rd
- 840 Old Driver Rd