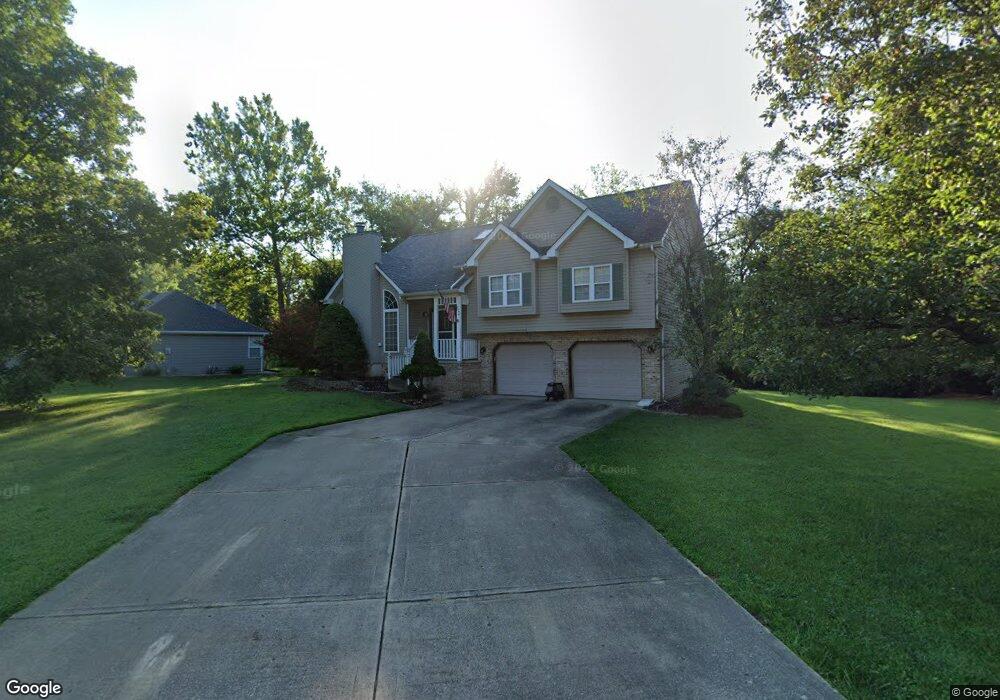
53 Morningside Dr Glen Carbon, IL 62034
Estimated Value: $276,000 - $326,000
5
Beds
4
Baths
1,179
Sq Ft
$259/Sq Ft
Est. Value
About This Home
This home is located at 53 Morningside Dr, Glen Carbon, IL 62034 and is currently estimated at $305,924, approximately $259 per square foot. 53 Morningside Dr is a home located in Madison County with nearby schools including Glen Carbon Elementary School, Albert Cassens Elementary School, and Liberty Middle School.
Ownership History
Date
Name
Owned For
Owner Type
Purchase Details
Closed on
Dec 23, 2019
Sold by
Rendleman Timothy C
Bought by
Rendleman Tim and Rendleman Susan M
Current Estimated Value
Purchase Details
Closed on
Feb 18, 2011
Sold by
Rendleman Timothy C and Rendleman Susan M
Bought by
Rendleman Timothy C
Home Financials for this Owner
Home Financials are based on the most recent Mortgage that was taken out on this home.
Original Mortgage
$160,590
Outstanding Balance
$110,356
Interest Rate
4.87%
Mortgage Type
FHA
Estimated Equity
$195,568
Purchase Details
Closed on
Oct 23, 2003
Sold by
Hessler Rodney and Hessler Christine
Bought by
Rendleman Timothy C and Rendleman Susan M
Home Financials for this Owner
Home Financials are based on the most recent Mortgage that was taken out on this home.
Original Mortgage
$160,000
Interest Rate
4.5%
Mortgage Type
Purchase Money Mortgage
Create a Home Valuation Report for This Property
The Home Valuation Report is an in-depth analysis detailing your home's value as well as a comparison with similar homes in the area
Home Values in the Area
Average Home Value in this Area
Purchase History
| Date | Buyer | Sale Price | Title Company |
|---|---|---|---|
| Rendleman Tim | -- | Freedom Title | |
| Rendleman Timothy C | -- | Accent Title Inc | |
| Rendleman Timothy C | $168,500 | Abstracts & Titles Inc |
Source: Public Records
Mortgage History
| Date | Status | Borrower | Loan Amount |
|---|---|---|---|
| Open | Rendleman Timothy C | $160,590 | |
| Closed | Rendleman Timothy C | $160,000 |
Source: Public Records
Tax History Compared to Growth
Tax History
| Year | Tax Paid | Tax Assessment Tax Assessment Total Assessment is a certain percentage of the fair market value that is determined by local assessors to be the total taxable value of land and additions on the property. | Land | Improvement |
|---|---|---|---|---|
| 2024 | $6,164 | $93,500 | $13,320 | $80,180 |
| 2023 | $6,164 | $86,770 | $12,360 | $74,410 |
| 2022 | $5,841 | $80,210 | $11,430 | $68,780 |
| 2021 | $5,278 | $76,130 | $10,850 | $65,280 |
| 2020 | $5,123 | $73,770 | $10,510 | $63,260 |
| 2019 | $5,065 | $72,530 | $10,330 | $62,200 |
| 2018 | $4,974 | $69,260 | $9,860 | $59,400 |
| 2017 | $4,897 | $67,790 | $9,650 | $58,140 |
| 2016 | $4,436 | $67,790 | $9,650 | $58,140 |
| 2015 | $4,115 | $62,830 | $8,940 | $53,890 |
| 2014 | $4,115 | $62,830 | $8,940 | $53,890 |
| 2013 | $4,115 | $62,830 | $8,940 | $53,890 |
Source: Public Records
Map
Nearby Homes
- 71 Hillsborough Ave
- 6 Shaderest Ct
- 204 Aspen Point
- 505 Huntington
- 3 Schon Ct
- 9 Schon Ct
- 6 Schon Ct
- 8 Schon Ct
- 101 Quail Creek Ct
- 99 Quail Creek Ct
- 98 Quail Creek Ct
- 102 Quail Creek Ct
- 100 Quail Creek Ct
- 315 Hidden Hills Dr (Lot 12)
- 109 Kingsbrooke Blvd
- 520 Hidden Hills Dr
- 420 Hidden Hills Dr
- 505 Hidden Hills Dr
- 419 Hidden Hills Dr
- 404 Hidden Hills Dr
- 52 Morningside Dr
- 51 Morningside Dr
- 2 Morningside Dr
- 1 Morningside Dr
- 89 Morningside Dr
- 88 Morningside Dr
- 99 Michelle Dr
- 87 Morningside Dr
- 90 Morningside Dr
- 269 Glen Crossing Rd
- 265 Glen Crossing Rd
- 86 Morningside Dr
- 3 Englewood Dr
- 1 Dean Park Place
- 316 Glen Crossing Rd
- 50 Morningside Dr
- 85 Morningside Dr
- 3 Shaderest Ct
- 3 Shaderest Ct
- 100 Michelle Dr