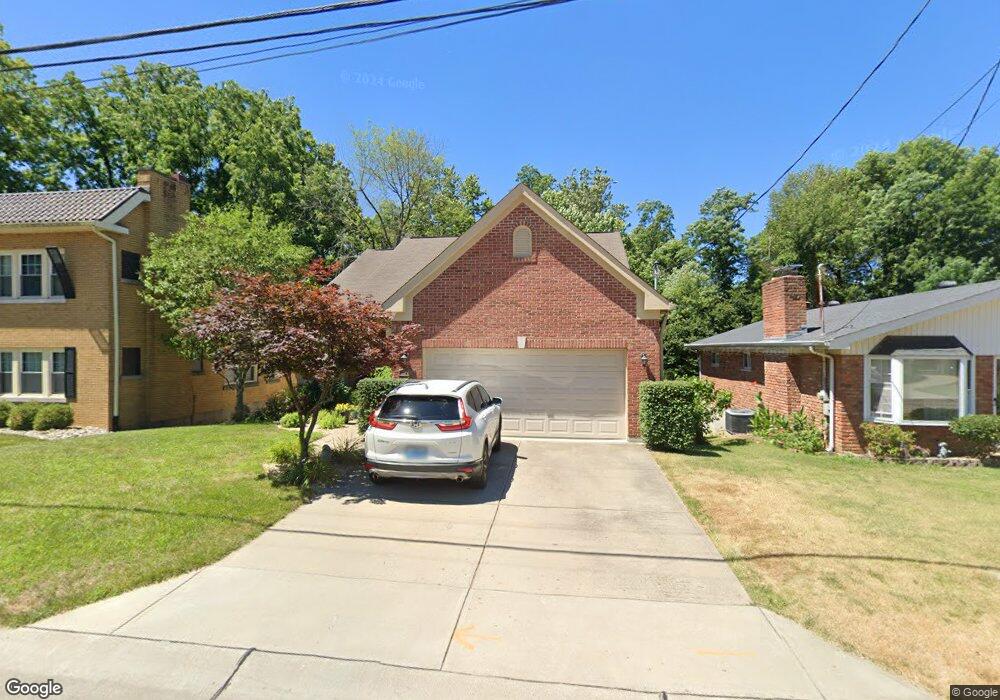
53 Morris Place Covington, KY 41011
Estimated Value: $377,952 - $463,000
3
Beds
3
Baths
1,378
Sq Ft
$311/Sq Ft
Est. Value
About This Home
This home is located at 53 Morris Place, Covington, KY 41011 and is currently estimated at $427,988, approximately $310 per square foot. 53 Morris Place is a home located in Kenton County with nearby schools including Fort Wright Elementary School, Turkey Foot Middle School, and Dixie Heights High School.
Ownership History
Date
Name
Owned For
Owner Type
Purchase Details
Closed on
Jul 7, 2020
Sold by
Lovelace Rachel E and Lovelace Rachel E
Bought by
Harris John and Harris Janet
Current Estimated Value
Purchase Details
Closed on
Jul 14, 2014
Sold by
Strunk Michael J and Strunk Sharon R
Bought by
Lovelace Kenneth E and Lovelace Rachel E
Home Financials for this Owner
Home Financials are based on the most recent Mortgage that was taken out on this home.
Original Mortgage
$236,500
Interest Rate
4.2%
Mortgage Type
VA
Purchase Details
Closed on
Oct 22, 2007
Sold by
Schultz Steven A and Schultz Jean A
Bought by
Strunk Michael J and Strunk Sharon R
Home Financials for this Owner
Home Financials are based on the most recent Mortgage that was taken out on this home.
Original Mortgage
$183,100
Interest Rate
6.26%
Mortgage Type
Balloon
Create a Home Valuation Report for This Property
The Home Valuation Report is an in-depth analysis detailing your home's value as well as a comparison with similar homes in the area
Home Values in the Area
Average Home Value in this Area
Purchase History
| Date | Buyer | Sale Price | Title Company |
|---|---|---|---|
| Harris John | $295,000 | Terry Monnie Title | |
| Lovelace Kenneth E | $236,500 | Lawyers Title | |
| Strunk Michael J | $228,964 | None Available |
Source: Public Records
Mortgage History
| Date | Status | Borrower | Loan Amount |
|---|---|---|---|
| Previous Owner | Lovelace Kenneth E | $236,500 | |
| Previous Owner | Strunk Michael J | $183,100 |
Source: Public Records
Tax History Compared to Growth
Tax History
| Year | Tax Paid | Tax Assessment Tax Assessment Total Assessment is a certain percentage of the fair market value that is determined by local assessors to be the total taxable value of land and additions on the property. | Land | Improvement |
|---|---|---|---|---|
| 2025 | $2,923 | $295,000 | $40,000 | $255,000 |
| 2024 | $3,024 | $295,000 | $40,000 | $255,000 |
| 2023 | $3,145 | $295,000 | $40,000 | $255,000 |
| 2022 | $3,232 | $295,000 | $40,000 | $255,000 |
| 2021 | $3,300 | $295,000 | $40,000 | $255,000 |
| 2020 | $2,949 | $260,100 | $40,000 | $220,100 |
| 2019 | $2,697 | $236,500 | $40,000 | $196,500 |
| 2018 | $2,704 | $236,500 | $40,000 | $196,500 |
| 2017 | $2,629 | $236,500 | $40,000 | $196,500 |
| 2015 | $2,544 | $236,500 | $40,000 | $196,500 |
| 2014 | $2,051 | $228,900 | $40,000 | $188,900 |
Source: Public Records
Map
Nearby Homes
- 1660 Amsterdam Rd
- 131 Kennedy Rd
- 215 Fort Mitchell Ave Unit 4
- 1715 Fort Henry Dr
- 40 W Crittenden Ave
- 1316 Old State Rd
- 114 W Maple Ave
- 1732 Highland Ave
- 1504 Dixie Hwy
- 576 Cloverfield Ln Unit 308
- 2021 Edenderry Dr
- 268 Meridian Way
- 272 Meridian Way Unit 8-603
- 274 Meridian Way Unit 8-602
- 270 Meridian Way
- Camden Plan at The Pinnacle at Fort Mitchell - Designer Collection
- 266 Meridian Way Unit 8-606
- 276 Meridian Way Unit 8-601
- 268 Meridian Way Unit 8-605
- 274 Meridian Way