
Landlord's Agent in 2024
Eddie Gutierrez
BHGRE Gaetano Marra Homes
(203) 257-9954
4 in this area
89 Total Sales
Estimated Value: $478,000 - $738,000
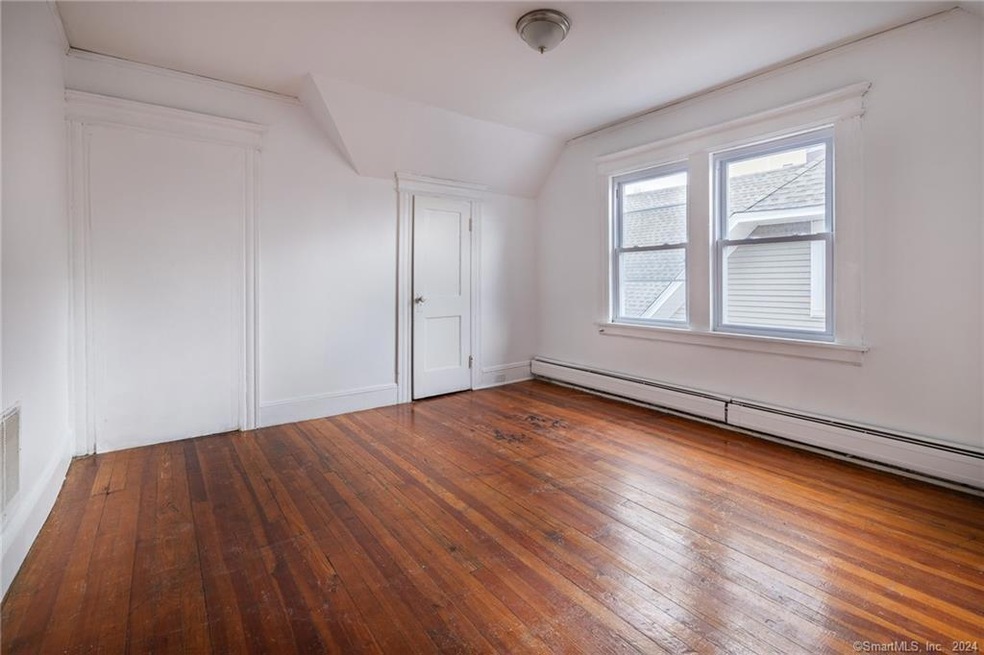
Welcome to this 3-bedroom apartment situated on the third floor of a walk-up building in the vibrant University of Bridgeport neighborhood in the South End. Enjoy the perfect blend of convenience and style, with the added bonus of being just a short walk from Seaside Park and Beach. This prime location offers a unique opportunity to experience city living while having easy access to tranquil outdoor spaces. Step inside to discover the timeless elegance of hardwood floors that grace the entire unit, providing a warm and welcoming ambiance. The well-thought-out floor plan optimizes space, creating a comfortable and versatile living environment. Each of the three bedrooms offers a retreat-like atmosphere, ensuring ample privacy and relaxation for all residents. One of the standout features of this apartment is the updated kitchen, boasting modern white cabinets and sleek granite countertops. This contemporary kitchen space not only enhances the aesthetic appeal of the unit but also provides a functional and stylish area for cooking and entertaining. With its generous size, prime location, and attractive features, this 3-bedroom apartment is a fantastic opportunity for those seeking a harmonious blend of city and seaside living. Don't miss out – schedule a viewing today to experience the comfort and elegance this home has to offer!
Last Agent to Rent the Property
BHGRE Gaetano Marra Homes License #REB.0758749 Listed on: 02/23/2024
| Date | Event | Price | List to Sale | Price per Sq Ft |
|---|---|---|---|---|
| 03/30/2024 03/30/24 | Rented | $1,500 | 0.0% | -- |
| 02/23/2024 02/23/24 | For Rent | $1,500 | -- | -- |
| Year | Tax Paid | Tax Assessment Tax Assessment Total Assessment is a certain percentage of the fair market value that is determined by local assessors to be the total taxable value of land and additions on the property. | Land | Improvement |
|---|---|---|---|---|
| 2025 | $8,322 | $191,520 | $36,550 | $154,970 |
| 2024 | $8,322 | $191,520 | $36,550 | $154,970 |
| 2023 | $8,322 | $191,520 | $36,550 | $154,970 |
| 2022 | $8,322 | $191,520 | $36,550 | $154,970 |
| 2021 | $8,322 | $191,520 | $36,550 | $154,970 |
| 2020 | $8,803 | $163,050 | $34,010 | $129,040 |
| 2019 | $8,803 | $163,050 | $34,010 | $129,040 |
| 2018 | $8,865 | $163,050 | $34,010 | $129,040 |
| 2017 | $8,865 | $163,050 | $34,010 | $129,040 |
| 2016 | $8,865 | $163,050 | $34,010 | $129,040 |
| 2015 | $9,216 | $218,400 | $47,850 | $170,550 |
| 2014 | $9,216 | $218,400 | $47,850 | $170,550 |
Landlord's Agent in 2024
Eddie Gutierrez
BHGRE Gaetano Marra Homes
(203) 257-9954
4 in this area
89 Total Sales
Landlord's Co-Listing Agent in 2024
Cynthia Lucero
BHGRE Gaetano Marra Homes
(203) 258-9821
2 in this area
61 Total Sales
Tenant's Agent in 2024
Angel Mora
eXp Realty
(203) 666-1172
218 Total Sales
Source: SmartMLS
MLS Number: 170626477
APN: BRID-000541-000008
Disclaimer: Certain information contained herein is derived from information provided by parties other than Homes.com. All information provided is deemed reliable, but is not guaranteed to be accurate and should be independently verified.
![]() IDX information is provided exclusively for personal, non-commercial use, and may not be used for any purpose other than to identify prospective properties consumers may be interested in purchasing. Information is deemed reliable but not guaranteed.
IDX information is provided exclusively for personal, non-commercial use, and may not be used for any purpose other than to identify prospective properties consumers may be interested in purchasing. Information is deemed reliable but not guaranteed.