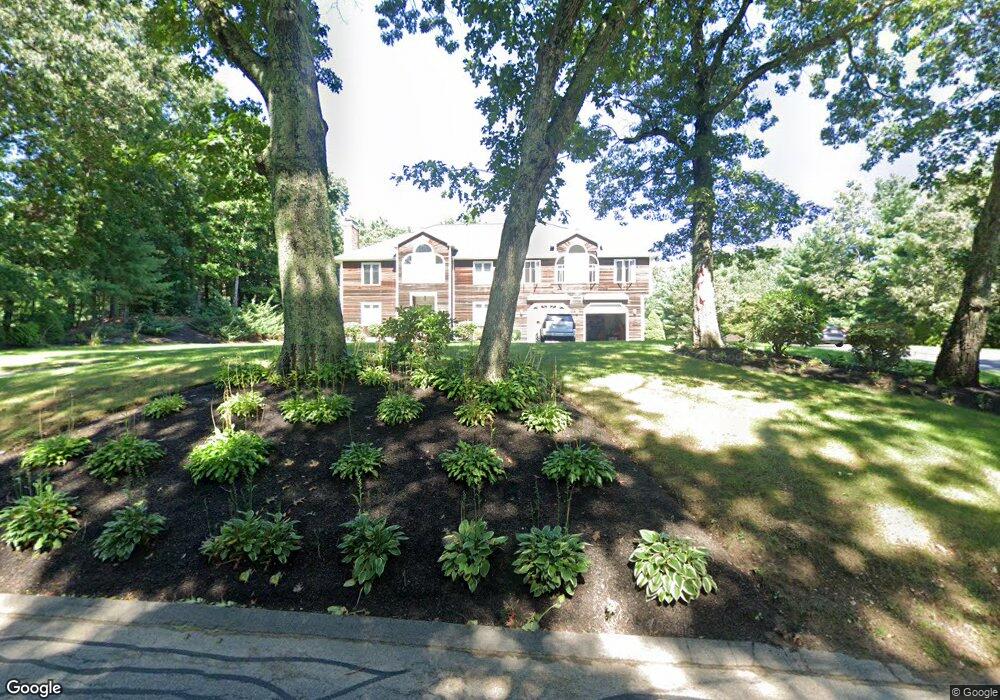
53 Myrtle St Wrentham, MA 02093
Estimated Value: $1,008,000 - $1,401,000
4
Beds
3
Baths
4,014
Sq Ft
$285/Sq Ft
Est. Value
About This Home
This home is located at 53 Myrtle St, Wrentham, MA 02093 and is currently estimated at $1,143,572, approximately $284 per square foot. 53 Myrtle St is a home located in Norfolk County with nearby schools including Delaney Elementary School, Charles E Roderick, and Foxborough Regional Charter School.
Ownership History
Date
Name
Owned For
Owner Type
Purchase Details
Closed on
Jan 23, 2020
Sold by
Obrien Dennis F
Bought by
Dennis F Obrien 1 Lt
Current Estimated Value
Create a Home Valuation Report for This Property
The Home Valuation Report is an in-depth analysis detailing your home's value as well as a comparison with similar homes in the area
Purchase History
| Date | Buyer | Sale Price | Title Company |
|---|---|---|---|
| Dennis F Obrien 1 Lt | -- | None Available |
Source: Public Records
Tax History Compared to Growth
Tax History
| Year | Tax Paid | Tax Assessment Tax Assessment Total Assessment is a certain percentage of the fair market value that is determined by local assessors to be the total taxable value of land and additions on the property. | Land | Improvement |
|---|---|---|---|---|
| 2025 | $11,140 | $961,200 | $303,400 | $657,800 |
| 2024 | $10,565 | $880,400 | $303,400 | $577,000 |
| 2023 | $10,516 | $833,300 | $275,800 | $557,500 |
| 2022 | $9,894 | $723,800 | $257,300 | $466,500 |
| 2021 | $9,186 | $652,900 | $224,700 | $428,200 |
| 2020 | $9,844 | $690,800 | $199,900 | $490,900 |
| 2019 | $9,431 | $667,900 | $199,900 | $468,000 |
| 2018 | $9,005 | $632,400 | $200,200 | $432,200 |
| 2017 | $8,819 | $618,900 | $196,300 | $422,600 |
| 2016 | $8,639 | $605,000 | $190,600 | $414,400 |
| 2015 | $8,663 | $578,300 | $183,300 | $395,000 |
| 2014 | $8,071 | $527,200 | $147,100 | $380,100 |
Source: Public Records
Map
Nearby Homes
- 19 Nadeau Dr
- 155 Clark Rd Unit 155
- 1 Lorraine Metcalf Dr
- 483 Thurston St
- 10 Nature View Dr
- 15 Nature View Dr
- 557 Dedham St
- 319 Taunton St
- 25 Foxboro Rd
- 131 Washington St Unit 42
- 131 Washington St Unit 50
- 692 Dedham St
- 11 Weber Farm Rd Unit 11
- 8 Weber Farm Rd Unit 8
- 11 Goodwin Dr
- 30 Weber Farm Rd Unit 30
- 9 Sharon Ave
- 11 Sharon Ave
- 131 Creek St Unit 7
- 11 Earle Stewart Ln