Estimated Value: $455,000 - $490,000
3
Beds
3
Baths
2,330
Sq Ft
$204/Sq Ft
Est. Value
About This Home
This home is located at 53 N 2150 W, Lehi, UT 84043 and is currently estimated at $475,191, approximately $203 per square foot. 53 N 2150 W is a home located in Utah County with nearby schools including River Rock Elementary, Willowcreek Middle School, and Lehi High School.
Ownership History
Date
Name
Owned For
Owner Type
Purchase Details
Closed on
Mar 18, 2022
Sold by
Clark Colby T
Bought by
Clark Colby Thatcher
Current Estimated Value
Home Financials for this Owner
Home Financials are based on the most recent Mortgage that was taken out on this home.
Original Mortgage
$399,200
Outstanding Balance
$372,002
Interest Rate
3.69%
Mortgage Type
New Conventional
Estimated Equity
$103,189
Purchase Details
Closed on
Jan 6, 2020
Sold by
Halsey Brad and Halsey Abbey
Bought by
Clark Colby T and Clark Alyssa A
Home Financials for this Owner
Home Financials are based on the most recent Mortgage that was taken out on this home.
Original Mortgage
$304,000
Interest Rate
3.6%
Mortgage Type
New Conventional
Purchase Details
Closed on
May 31, 2017
Sold by
Edge Gateway Llc
Bought by
Halsey Brad and Halsey Abbey
Home Financials for this Owner
Home Financials are based on the most recent Mortgage that was taken out on this home.
Original Mortgage
$259,233
Interest Rate
4.03%
Mortgage Type
New Conventional
Create a Home Valuation Report for This Property
The Home Valuation Report is an in-depth analysis detailing your home's value as well as a comparison with similar homes in the area
Home Values in the Area
Average Home Value in this Area
Purchase History
| Date | Buyer | Sale Price | Title Company |
|---|---|---|---|
| Clark Colby Thatcher | -- | New Title Company Name | |
| Clark Colby T | -- | Cottonwood Ttl Ins Agcy Inc | |
| Halsey Brad | -- | Provo Land Title Co |
Source: Public Records
Mortgage History
| Date | Status | Borrower | Loan Amount |
|---|---|---|---|
| Open | Clark Colby Thatcher | $399,200 | |
| Previous Owner | Clark Colby T | $304,000 | |
| Previous Owner | Halsey Brad | $259,233 |
Source: Public Records
Tax History Compared to Growth
Tax History
| Year | Tax Paid | Tax Assessment Tax Assessment Total Assessment is a certain percentage of the fair market value that is determined by local assessors to be the total taxable value of land and additions on the property. | Land | Improvement |
|---|---|---|---|---|
| 2025 | $2,060 | $245,190 | $65,500 | $380,300 |
| 2024 | $2,060 | $241,065 | $0 | $0 |
| 2023 | $1,826 | $232,045 | $0 | $0 |
| 2022 | $1,992 | $245,410 | $0 | $0 |
| 2021 | $1,802 | $335,500 | $50,300 | $285,200 |
| 2020 | $1,673 | $308,000 | $46,200 | $261,800 |
| 2019 | $1,563 | $299,100 | $44,900 | $254,200 |
| 2018 | $1,377 | $249,100 | $37,400 | $211,700 |
| 2017 | $260 | $25,000 | $0 | $0 |
Source: Public Records
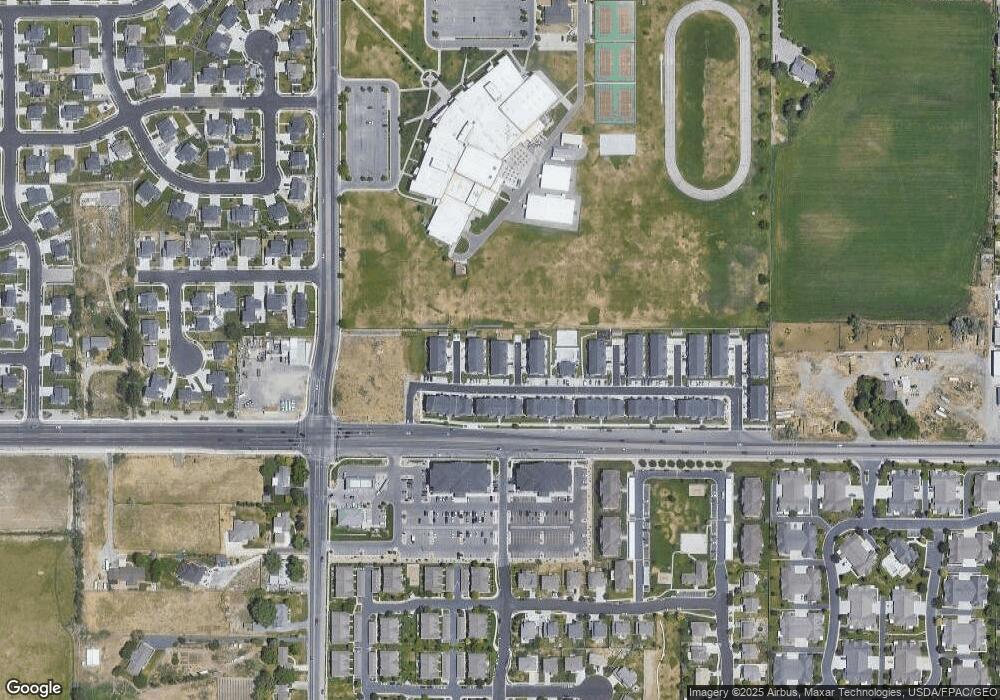
Map
Nearby Homes
- 41 N 2150 W
- 2178 W Main St Unit D301
- 2162 W Main St Unit E303
- 210 S Tamarak Cir
- 122 N 2430 W Unit 1
- 202 S 2035 W
- 105 N 2430 W
- The Roslyn Plan at Carla's Cove
- The Tracie Plan at Carla's Cove
- The Brooke Plan at Carla's Cove
- The Jackie Plan at Carla's Cove
- 131 S 1900 W Unit 2
- 373 N Willow Haven Ave
- 1784 W Grays Place
- 2727 W 110 N
- 1743 W Grays Place
- 2512 W 610 N Unit 99
- 603 S 2500 W
- 2817 W Willow Dr
- 161 S 1475 W
- 53 N 2150 W Unit 112
- 53 W 2150
- 49 N 2150 W Unit 111
- 45 N 2150 W Unit 110
- 45 N 2150 W
- 56 N 2200 W Unit 108
- 41 N 2150 W Unit 109
- 52 N 2200 W Unit 107
- 46 N 2200 W Unit 106
- 42 N 2200 W Unit 105
- 50 N 2150 W Unit 115
- 54 N 2150 W Unit 116
- 46 N 2150 W Unit 114
- 46 N 2150 W
- 42 N 2150 W Unit 113
- 42 N 2150 W
- 57 N 2200 W Unit 104
- 57 N 2200 W
- 53 N 2200 W Unit 103
- 47 N 2200 W