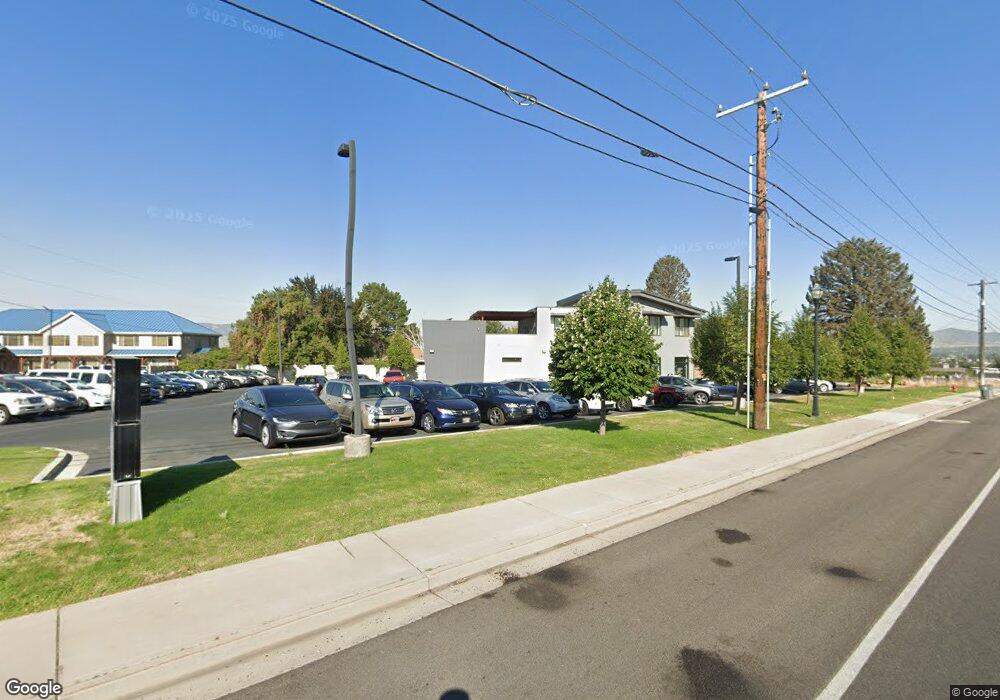
53 N State St Lindon, UT 84042
--
Bed
--
Bath
3,419
Sq Ft
0.64
Acres
About This Home
This home is located at 53 N State St, Lindon, UT 84042. 53 N State St is a home located in Utah County with nearby schools including Aspen Elementary School, Oak Canyon Junior High School, and Pleasant Grove High School.
Ownership History
Date
Name
Owned For
Owner Type
Purchase Details
Closed on
Dec 28, 2016
Sold by
Pierce Brandon
Bought by
Qulaity Real Estate And Management Llc
Purchase Details
Closed on
Apr 29, 2015
Sold by
The Harold & Elvie Erickson Family Limit
Bought by
Pierce Brandon
Create a Home Valuation Report for This Property
The Home Valuation Report is an in-depth analysis detailing your home's value as well as a comparison with similar homes in the area
Home Values in the Area
Average Home Value in this Area
Purchase History
| Date | Buyer | Sale Price | Title Company |
|---|---|---|---|
| Qulaity Real Estate And Management Llc | -- | None Available | |
| Pierce Brandon | -- | Union Title |
Source: Public Records
Tax History Compared to Growth
Tax History
| Year | Tax Paid | Tax Assessment Tax Assessment Total Assessment is a certain percentage of the fair market value that is determined by local assessors to be the total taxable value of land and additions on the property. | Land | Improvement |
|---|---|---|---|---|
| 2025 | $7,892 | $978,300 | $430,400 | $547,900 |
| 2024 | $7,892 | $972,900 | $0 | $0 |
| 2023 | $6,683 | $884,900 | $0 | $0 |
| 2022 | $6,595 | $843,600 | $400,700 | $442,900 |
| 2021 | $6,501 | $689,600 | $376,700 | $312,900 |
| 2020 | $6,474 | $676,100 | $376,700 | $299,400 |
| 2019 | $5,886 | $641,300 | $341,900 | $299,400 |
| 2018 | $6,086 | $625,100 | $325,700 | $299,400 |
| 2017 | $6,090 | $609,800 | $0 | $0 |
| 2016 | $3,192 | $295,600 | $0 | $0 |
| 2015 | $2,981 | $261,000 | $0 | $0 |
| 2014 | $2,606 | $226,000 | $0 | $0 |
Source: Public Records
Map
Nearby Homes