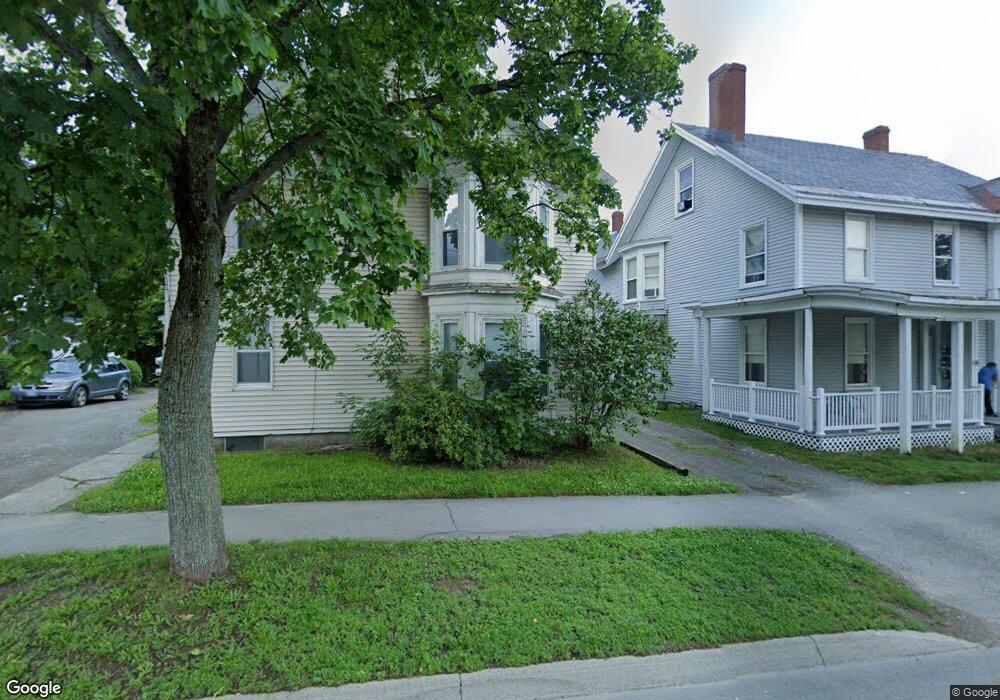
53 Ohio St Unit A Bangor, ME 04401
West Bangor NeighborhoodEstimated Value: $278,000 - $751,000
2
Beds
1
Bath
2,490
Sq Ft
$172/Sq Ft
Est. Value
About This Home
This home is located at 53 Ohio St Unit A, Bangor, ME 04401 and is currently estimated at $427,324, approximately $171 per square foot. 53 Ohio St Unit A is a home located in Penobscot County with nearby schools including Vine Street School, Fairmount School, and James F. Doughty School.
Ownership History
Date
Name
Owned For
Owner Type
Purchase Details
Closed on
Mar 13, 2020
Sold by
Turner Daniel
Bought by
Keeler Enterprises Llc
Current Estimated Value
Home Financials for this Owner
Home Financials are based on the most recent Mortgage that was taken out on this home.
Original Mortgage
$187,200
Outstanding Balance
$165,476
Interest Rate
3.4%
Mortgage Type
Stand Alone Refi Refinance Of Original Loan
Estimated Equity
$261,848
Create a Home Valuation Report for This Property
The Home Valuation Report is an in-depth analysis detailing your home's value as well as a comparison with similar homes in the area
Home Values in the Area
Average Home Value in this Area
Purchase History
| Date | Buyer | Sale Price | Title Company |
|---|---|---|---|
| Keeler Enterprises Llc | -- | None Available | |
| Keeler Enterprises Llc | -- | None Available | |
| Keeler Enterprises Llc | -- | None Available |
Source: Public Records
Mortgage History
| Date | Status | Borrower | Loan Amount |
|---|---|---|---|
| Open | Keeler Enterprises Llc | $187,200 | |
| Closed | Keeler Enterprises Llc | $187,200 |
Source: Public Records
Tax History Compared to Growth
Tax History
| Year | Tax Paid | Tax Assessment Tax Assessment Total Assessment is a certain percentage of the fair market value that is determined by local assessors to be the total taxable value of land and additions on the property. | Land | Improvement |
|---|---|---|---|---|
| 2024 | $3,586 | $193,300 | $11,500 | $181,800 |
| 2023 | $3,361 | $175,500 | $11,500 | $164,000 |
| 2022 | $3,048 | $149,400 | $11,500 | $137,900 |
| 2021 | $2,993 | $134,200 | $11,100 | $123,100 |
| 2020 | $2,863 | $123,400 | $10,600 | $112,800 |
| 2019 | -- | $56,000 | $5,300 | $50,700 |
| 2018 | -- | $52,800 | $5,300 | $47,500 |
| 2017 | -- | $52,600 | $5,300 | $47,300 |
| 2016 | -- | $51,400 | $5,300 | $46,100 |
| 2015 | -- | $51,900 | $5,300 | $46,600 |
| 2014 | -- | $51,000 | $5,300 | $45,700 |
Source: Public Records
Map
Nearby Homes