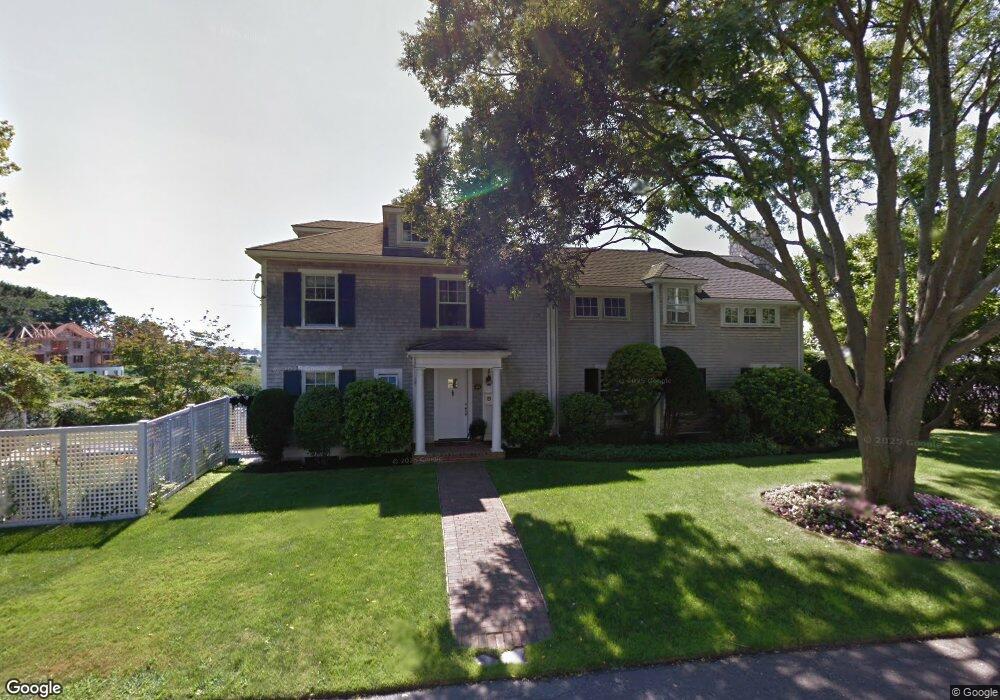
53 Orchard St Marblehead, MA 01945
Estimated Value: $2,212,000 - $2,425,069
4
Beds
4
Baths
3,154
Sq Ft
$728/Sq Ft
Est. Value
About This Home
This home is located at 53 Orchard St, Marblehead, MA 01945 and is currently estimated at $2,296,267, approximately $728 per square foot. 53 Orchard St is a home located in Essex County with nearby schools including Marblehead High School, Devereux School, and Tower School.
Ownership History
Date
Name
Owned For
Owner Type
Purchase Details
Closed on
Nov 2, 2018
Sold by
Conway Peter C and Conway Suzanne P
Bought by
53 Orchard Street Nt
Current Estimated Value
Purchase Details
Closed on
Apr 19, 2017
Sold by
53 Orchard Street Nt and Conway
Bought by
Conway Peter C and Conway Suzanne P
Home Financials for this Owner
Home Financials are based on the most recent Mortgage that was taken out on this home.
Original Mortgage
$539,000
Interest Rate
3.5%
Mortgage Type
Adjustable Rate Mortgage/ARM
Purchase Details
Closed on
Aug 27, 2015
Sold by
Conway Peter C and Conway Suzanne P
Bought by
53 Orchard Street Nt and Conway
Purchase Details
Closed on
Jun 7, 1991
Sold by
Kemage Peter B
Bought by
Conway Peter C
Create a Home Valuation Report for This Property
The Home Valuation Report is an in-depth analysis detailing your home's value as well as a comparison with similar homes in the area
Home Values in the Area
Average Home Value in this Area
Purchase History
| Date | Buyer | Sale Price | Title Company |
|---|---|---|---|
| 53 Orchard Street Nt | -- | -- | |
| 53 Orchard Street Nt | -- | -- | |
| 53 Orchard Street Nt | -- | -- | |
| Conway Peter C | -- | -- | |
| Conway Peter C | -- | -- | |
| 53 Orchard Street Nt | -- | -- | |
| 53 Orchard Street Nt | -- | -- | |
| Conway Peter C | $450,000 | -- | |
| Conway Peter C | $450,000 | -- |
Source: Public Records
Mortgage History
| Date | Status | Borrower | Loan Amount |
|---|---|---|---|
| Previous Owner | Conway Peter C | $539,000 | |
| Previous Owner | Conway Peter C | $620,000 |
Source: Public Records
Tax History Compared to Growth
Tax History
| Year | Tax Paid | Tax Assessment Tax Assessment Total Assessment is a certain percentage of the fair market value that is determined by local assessors to be the total taxable value of land and additions on the property. | Land | Improvement |
|---|---|---|---|---|
| 2025 | $19,146 | $2,115,600 | $1,382,900 | $732,700 |
| 2024 | $18,303 | $2,042,700 | $1,333,500 | $709,200 |
| 2023 | $16,954 | $1,695,400 | $1,126,100 | $569,300 |
| 2022 | $17,503 | $1,663,800 | $1,106,300 | $557,500 |
| 2021 | $16,844 | $1,616,500 | $1,066,800 | $549,700 |
| 2020 | $17,684 | $1,702,000 | $1,185,300 | $516,700 |
| 2019 | $17,538 | $1,633,000 | $1,135,900 | $497,100 |
| 2018 | $17,451 | $1,583,600 | $1,086,500 | $497,100 |
| 2017 | $17,435 | $1,583,600 | $1,086,500 | $497,100 |
| 2016 | $15,948 | $1,436,800 | $1,086,500 | $350,300 |
| 2015 | $14,279 | $1,288,700 | $938,400 | $350,300 |
| 2014 | $14,085 | $1,270,100 | $938,400 | $331,700 |
Source: Public Records
Map
Nearby Homes
- 282 Pleasant St
- 6 Higgins Rd
- 41 Rowland St
- 41 Atlantic Ave Unit 1
- 60 Gregory St Unit 3
- 29 Village St Unit 1
- 2 Lindsey St
- 12 Heritage Way Unit 12
- 70 Maverick St
- 290 Washington St Unit 3
- 290 Washington St Unit 2
- 290 Washington St Unit 1
- 15 Lindsey St
- 34 Lafayette St
- 30 Amherst Rd
- 9 Skinner's Path Unit 9
- 3 Oak St
- 33 Waldron St
- 2 Martin St
- 19 Linden St