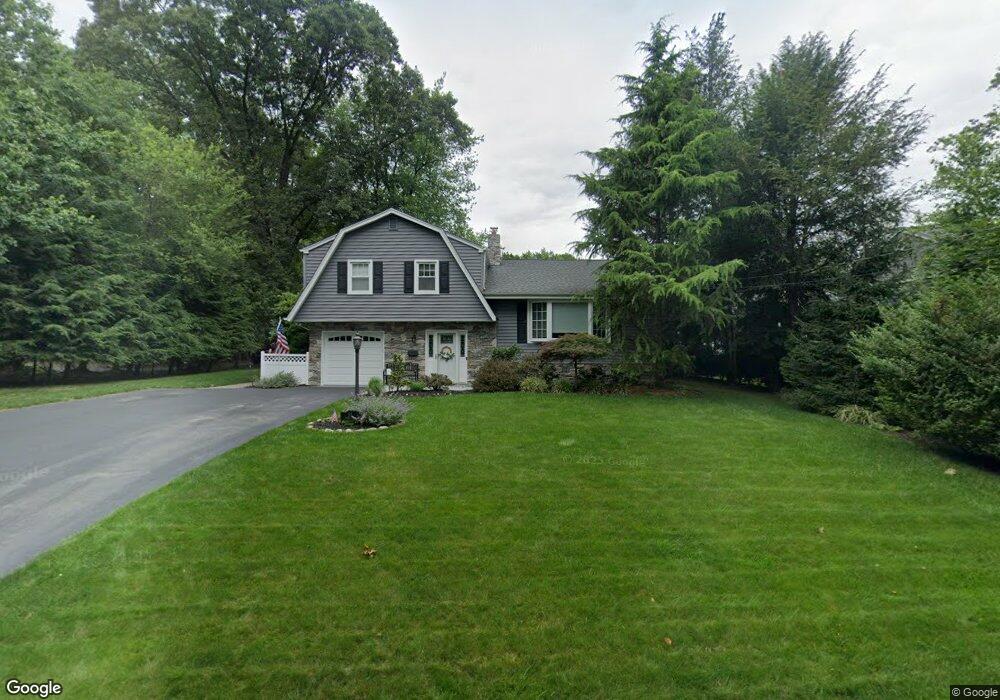
53 Osmers Way Haworth, NJ 07641
Estimated Value: $622,000 - $1,114,000
--
Bed
--
Bath
1,874
Sq Ft
$506/Sq Ft
Est. Value
About This Home
This home is located at 53 Osmers Way, Haworth, NJ 07641 and is currently estimated at $948,081, approximately $505 per square foot. 53 Osmers Way is a home located in Bergen County with nearby schools including Haworth Elementary School and Northern Valley Regional High School at Demarest.
Ownership History
Date
Name
Owned For
Owner Type
Purchase Details
Closed on
Jun 30, 2009
Sold by
Venditti Mary
Bought by
Kolkebeck Keith and Kolkebeck Jessica
Current Estimated Value
Home Financials for this Owner
Home Financials are based on the most recent Mortgage that was taken out on this home.
Original Mortgage
$375,000
Outstanding Balance
$244,749
Interest Rate
5.31%
Mortgage Type
Purchase Money Mortgage
Estimated Equity
$703,332
Create a Home Valuation Report for This Property
The Home Valuation Report is an in-depth analysis detailing your home's value as well as a comparison with similar homes in the area
Home Values in the Area
Average Home Value in this Area
Purchase History
| Date | Buyer | Sale Price | Title Company |
|---|---|---|---|
| Kolkebeck Keith | $475,000 | -- |
Source: Public Records
Mortgage History
| Date | Status | Borrower | Loan Amount |
|---|---|---|---|
| Open | Kolkebeck Keith | $375,000 |
Source: Public Records
Tax History Compared to Growth
Tax History
| Year | Tax Paid | Tax Assessment Tax Assessment Total Assessment is a certain percentage of the fair market value that is determined by local assessors to be the total taxable value of land and additions on the property. | Land | Improvement |
|---|---|---|---|---|
| 2025 | $16,313 | $527,600 | $281,000 | $246,600 |
| 2024 | $16,050 | $527,600 | $281,000 | $246,600 |
| 2023 | $15,717 | $527,600 | $281,000 | $246,600 |
| 2022 | $15,717 | $527,600 | $281,000 | $246,600 |
| 2021 | $15,533 | $527,600 | $281,000 | $246,600 |
| 2020 | $15,401 | $527,600 | $281,000 | $246,600 |
| 2019 | $14,622 | $502,300 | $281,000 | $221,300 |
| 2018 | $14,401 | $502,300 | $281,000 | $221,300 |
| 2017 | $14,481 | $502,300 | $281,000 | $221,300 |
| 2016 | $14,049 | $482,800 | $281,000 | $201,800 |
| 2015 | $13,494 | $482,800 | $281,000 | $201,800 |
| 2014 | $13,287 | $482,800 | $281,000 | $201,800 |
Source: Public Records
Map
Nearby Homes