Estimated Value: $143,548
3
Beds
2
Baths
848
Sq Ft
$169/Sq Ft
Est. Value
About This Home
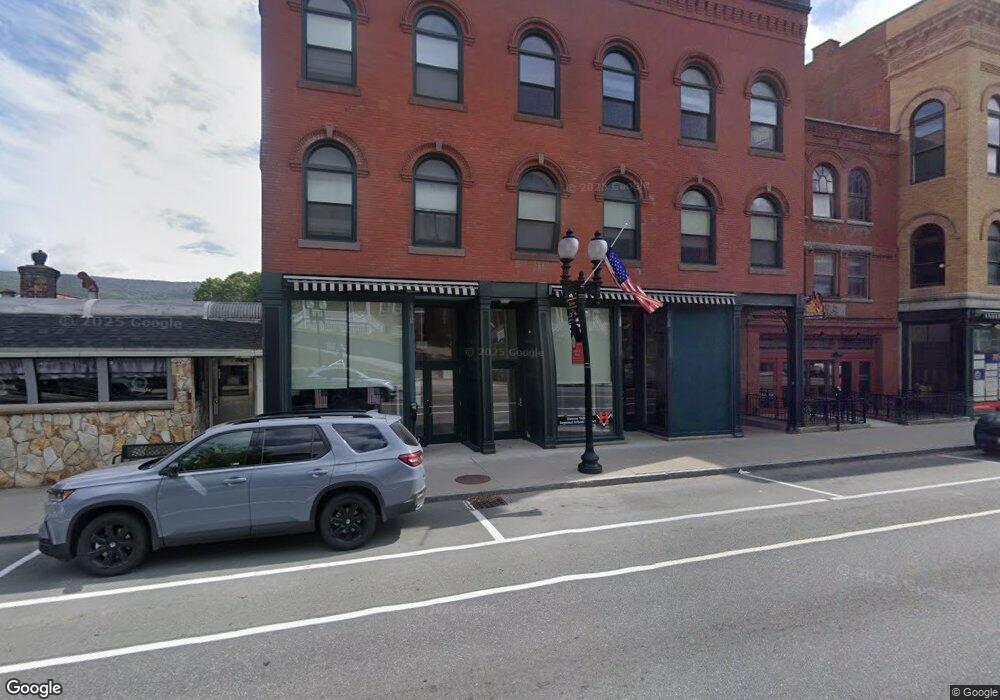
This home is located at 53 Park St, Adams, MA 01220 and is currently priced at $143,548, approximately $169 per square foot. 53 Park St is a home located in Berkshire County with nearby schools including Hoosac Valley Middle & High School, Berkshire Arts & Technology Charter Public School, and St. Stanislaus Kostka School.
Ownership History
Date
Name
Owned For
Owner Type
Purchase Details
Closed on
Aug 31, 2020
Sold by
Solomon Richard J
Bought by
Oleskiewicz Peter
Current Estimated Value
Purchase Details
Closed on
Nov 1, 2013
Sold by
Steepleview T
Bought by
Solomon Richard J
Home Financials for this Owner
Home Financials are based on the most recent Mortgage that was taken out on this home.
Original Mortgage
$116,300
Interest Rate
4.52%
Mortgage Type
Commercial
Purchase Details
Closed on
Nov 18, 2009
Sold by
Jaes Adams Inc and Berkshire Bk
Bought by
Steepleview T T and Steepleview Segala
Purchase Details
Closed on
Jun 8, 1998
Sold by
Garton Barry and Garton Mancy L
Bought by
Ic Jaes Admas
Purchase Details
Closed on
Feb 13, 1989
Sold by
Superneau Ernest P
Bought by
Garton Barry
Purchase Details
Closed on
Aug 21, 1987
Sold by
Alves Armond
Bought by
Superneau Ernest P
Create a Home Valuation Report for This Property
The Home Valuation Report is an in-depth analysis detailing your home's value as well as a comparison with similar homes in the area
Home Values in the Area
Average Home Value in this Area
Purchase History
| Date | Buyer | Sale Price | Title Company |
|---|---|---|---|
| Oleskiewicz Peter | $100,000 | None Available | |
| Solomon Richard J | $155,000 | -- | |
| Steepleview T T | $85,000 | -- | |
| Steepleview T T | $85,000 | -- | |
| Ic Jaes Admas | $94,000 | -- | |
| Jaes Admas Ic | $94,000 | -- | |
| Garton Barry | $111,000 | -- | |
| Superneau Ernest P | $100,000 | -- |
Source: Public Records
Mortgage History
| Date | Status | Borrower | Loan Amount |
|---|---|---|---|
| Previous Owner | Superneau Ernest P | $116,300 |
Source: Public Records
Tax History
| Year | Tax Paid | Tax Assessment Tax Assessment Total Assessment is a certain percentage of the fair market value that is determined by local assessors to be the total taxable value of land and additions on the property. | Land | Improvement |
|---|---|---|---|---|
| 2025 | $3,102 | $132,500 | $59,900 | $72,600 |
| 2024 | $3,012 | $124,300 | $55,900 | $68,400 |
| 2023 | $2,955 | $115,200 | $55,900 | $59,300 |
| 2022 | $2,629 | $100,500 | $52,000 | $48,500 |
| 2021 | $3,956 | $147,100 | $52,000 | $95,100 |
| 2020 | $4,130 | $158,900 | $63,900 | $95,000 |
| 2019 | $4,036 | $158,900 | $63,900 | $95,000 |
| 2018 | $4,009 | $157,100 | $63,900 | $93,200 |
| 2017 | $3,857 | $157,100 | $63,900 | $93,200 |
| 2016 | $3,970 | $152,700 | $63,900 | $88,800 |
| 2015 | $3,513 | $138,400 | $63,900 | $74,500 |
| 2014 | $3,326 | $140,400 | $65,900 | $74,500 |
Source: Public Records
Map
Nearby Homes
- 49 Park St Unit 53
- 49 Park St Unit 2
- 49 Park St Unit 6 (A)
- 49 Park St Unit 3
- 49 Park St Unit 5
- 49 Park St Unit B
- 49 Park St Unit C
- 49 Park St
- 47 Park St
- 45 & 49 Park St
- 43 Park St
- 59 Park St Unit 63
- 59 Park St Unit 2L
- 59 Park St Unit 3
- 63 Park St
- 57-63 Park St
- 3 School St
- 39 Park St
- 37 Park St
- 41 Rear Park St
Your Personal Tour Guide
Ask me questions while you tour the home.