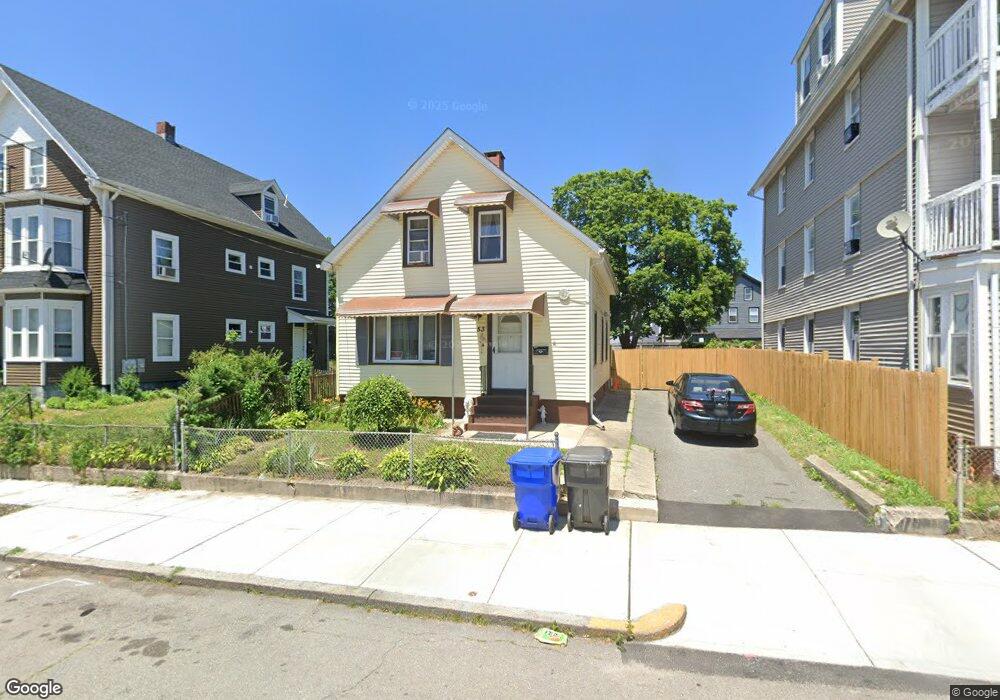
53 Parker St Central Falls, RI 02863
Estimated Value: $307,000 - $357,000
3
Beds
2
Baths
1,334
Sq Ft
$247/Sq Ft
Est. Value
About This Home
This home is located at 53 Parker St, Central Falls, RI 02863 and is currently estimated at $330,043, approximately $247 per square foot. 53 Parker St is a home located in Providence County with nearby schools including Central Falls Senior High School and Blackstone Valley Prep Junior High School.
Ownership History
Date
Name
Owned For
Owner Type
Purchase Details
Closed on
Feb 17, 2022
Sold by
Paniagua Raquel N and Ibanez Mery
Bought by
Paniagua Rossmery and Paniagua Raquel
Current Estimated Value
Purchase Details
Closed on
Jan 3, 2013
Sold by
Guardia Vanina
Bought by
Ri Hsng & Mtg Fin Corp
Purchase Details
Closed on
Apr 2, 2007
Sold by
Correia Jason and Correia Jessica
Bought by
Guardia Vanina
Home Financials for this Owner
Home Financials are based on the most recent Mortgage that was taken out on this home.
Original Mortgage
$155,065
Interest Rate
6.33%
Mortgage Type
Purchase Money Mortgage
Purchase Details
Closed on
May 8, 2003
Sold by
Proulx Rene H and Proulx Therese
Bought by
Correia Jason and Correia Jessica
Home Financials for this Owner
Home Financials are based on the most recent Mortgage that was taken out on this home.
Original Mortgage
$114,000
Interest Rate
5.93%
Mortgage Type
Purchase Money Mortgage
Create a Home Valuation Report for This Property
The Home Valuation Report is an in-depth analysis detailing your home's value as well as a comparison with similar homes in the area
Home Values in the Area
Average Home Value in this Area
Purchase History
| Date | Buyer | Sale Price | Title Company |
|---|---|---|---|
| Paniagua Rossmery | -- | None Available | |
| Ri Hsng & Mtg Fin Corp | $47,000 | -- | |
| Guardia Vanina | $170,000 | -- | |
| Correia Jason | $120,000 | -- |
Source: Public Records
Mortgage History
| Date | Status | Borrower | Loan Amount |
|---|---|---|---|
| Previous Owner | Correia Jason | $155,065 | |
| Previous Owner | Correia Jason | $10,000 | |
| Previous Owner | Correia Jason | $144,000 | |
| Previous Owner | Correia Jason | $114,000 |
Source: Public Records
Tax History
| Year | Tax Paid | Tax Assessment Tax Assessment Total Assessment is a certain percentage of the fair market value that is determined by local assessors to be the total taxable value of land and additions on the property. | Land | Improvement |
|---|---|---|---|---|
| 2025 | $3,836 | $290,400 | $110,800 | $179,600 |
| 2024 | $4,396 | $233,700 | $81,700 | $152,000 |
| 2023 | $4,335 | $233,700 | $81,700 | $152,000 |
| 2022 | $2,804 | $233,700 | $81,700 | $152,000 |
| 2021 | $3,181 | $133,900 | $29,400 | $104,500 |
| 2020 | $3,172 | $133,900 | $29,400 | $104,500 |
| 2019 | $3,315 | $133,900 | $29,400 | $104,500 |
| 2018 | $2,384 | $90,600 | $28,300 | $62,300 |
| 2017 | $2,384 | $90,600 | $28,300 | $62,300 |
| 2016 | $2,349 | $90,600 | $28,300 | $62,300 |
| 2015 | $2,191 | $79,300 | $26,700 | $52,600 |
| 2014 | $2,162 | $79,300 | $26,700 | $52,600 |
| 2013 | $2,040 | $79,300 | $26,700 | $52,600 |
Source: Public Records
Map
Nearby Homes
- 616 Lonsdale Ave Unit 618
- 722 Dexter St Unit 726
- 546 Lonsdale Ave Unit 548
- 35 Rand St
- 17 Beecher St
- 27 Lloyd St
- 66 Perry St
- 2 Valley St
- 129 Liberty St
- 152 Washington St
- 234 Central St Unit 236
- 75 Larch St
- 140 Dexter St
- 84 Barton St
- 78 Barton St
- 88 Barton St
- 14 Martin Ct
- 76 Sylvian St Unit 80
- 127 Chestnut St
- 584 Weeden St
- 57 Parker St
- 57 Parker St Unit 59
- 49 Parker St
- 47 Parker St
- 45 Parker St
- 60 Kendall St
- 66 Kendall St
- 56 Kendall St
- 41 Parker St Unit 43
- 60 Parker St
- 679 Lonsdale Ave
- 675 Lonsdale Ave
- 50 Kendall St Unit 52
- 72 Kendall St
- 70 Kendall St Unit 72
- 54 Parker St
- 50 Parker St Unit 52
- 44 Kendall St Unit 46
- 58 Parker St
- 37 Parker St Unit 39
Your Personal Tour Guide
Ask me questions while you tour the home.