53 Pleasant Hill Rd Lynchburg, TN 37352
Highlights
- 63 Acre Lot
- No HOA
- No Heating
- Hilly Lot
- Level Lot
About This Lot
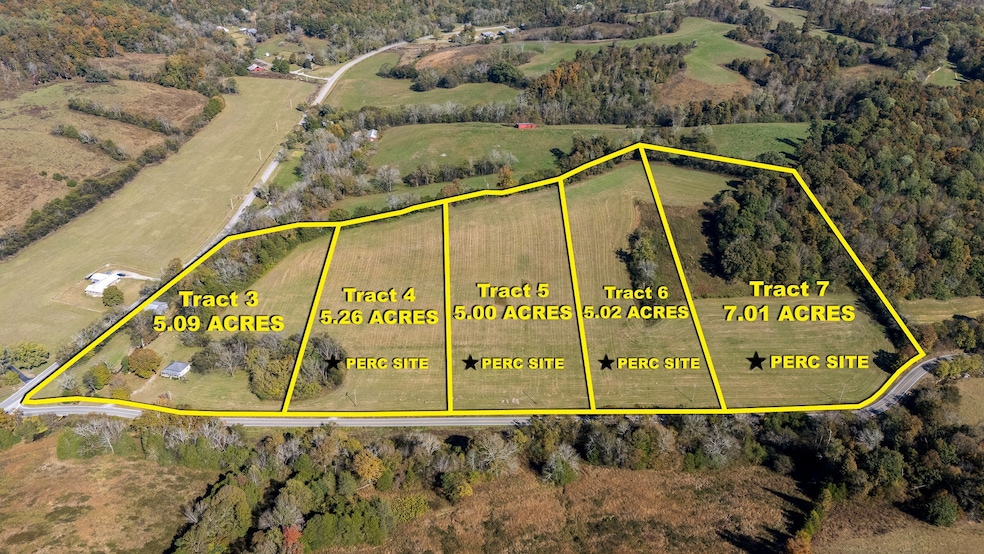
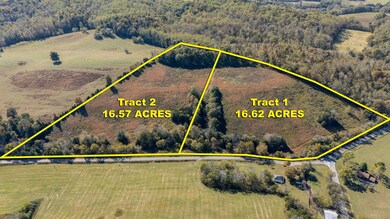
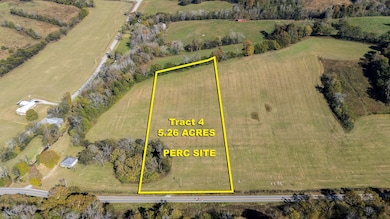
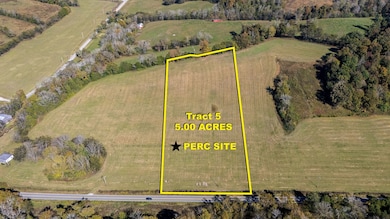
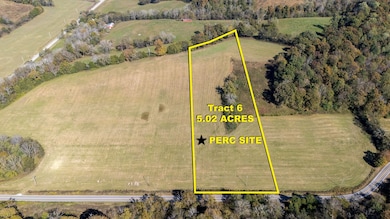
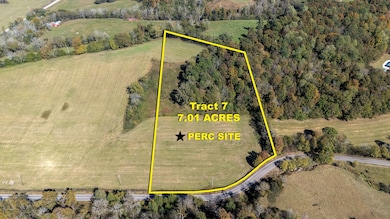
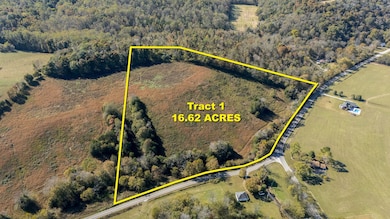
ABSOLUTE LIVE & ONLINE AUCTION ON TUESDAY DECEMBER 30TH AT 10:00 AM. HOUSE, 60.59 ACRES IN 7 TRACTS. Perc sites on tracts 4-7. 10% buyers premium added to final bid to determine final sales price!! Read all terms and conditions prior to bidding.
Listing Agent
Van Massey Realty & Auction Brokerage Phone: 9315801145 License #147317,355044 Listed on: 11/14/2025
Property Details
Property Type
- Land
Est. Annual Taxes
- $945
Lot Details
- 63 Acre Lot
- Property fronts a county road
- Level Lot
- Hilly Lot
- Cleared Lot
Schools
- Lynchburg Elementary School
- Moore County High Middle School
- Moore County High School
Community Details
- No Home Owners Association
Listing and Financial Details
- Assessor Parcel Number 025 01000 000
Map
Home Values in the Area
Average Home Value in this Area
Tax History
| Year | Tax Paid | Tax Assessment Tax Assessment Total Assessment is a certain percentage of the fair market value that is determined by local assessors to be the total taxable value of land and additions on the property. | Land | Improvement |
|---|---|---|---|---|
| 2025 | $945 | $60,400 | $0 | $0 |
| 2024 | $945 | $60,400 | $33,425 | $26,975 |
| 2023 | $804 | $33,225 | $21,350 | $11,875 |
| 2022 | $776 | $33,225 | $21,350 | $11,875 |
| 2021 | $763 | $33,225 | $21,350 | $11,875 |
| 2020 | $731 | $30,700 | $20,700 | $10,000 |
| 2019 | $731 | $30,700 | $20,700 | $10,000 |
| 2018 | $694 | $30,700 | $20,700 | $10,000 |
| 2017 | $655 | $24,725 | $17,400 | $7,325 |
| 2016 | $655 | $24,725 | $17,400 | $7,325 |
| 2015 | $601 | $24,725 | $17,400 | $7,325 |
| 2014 | $601 | $24,725 | $17,400 | $7,325 |
Property History
| Date | Event | Price | List to Sale | Price per Sq Ft |
|---|---|---|---|---|
| 11/14/2025 11/14/25 | For Sale | -- | -- | -- |
Purchase History
| Date | Type | Sale Price | Title Company |
|---|---|---|---|
| Deed | $130,950 | -- | |
| Deed | $100,000 | -- |
Source: Realtracs
MLS Number: 3046121
APN: 025-010.00
Disclaimer: Certain information contained herein is derived from information provided by parties other than Homes.com. All information provided is deemed reliable, but is not guaranteed to be accurate and should be independently verified.
![]() Based on information submitted to the MLS GRID. All data is obtained from various sources and may not have been verified by broker or MLS GRID. Supplied Open House Information is subject to change without notice. All information should be independently reviewed and verified for accuracy. Properties may or may not be listed by the office/agent presenting the information. Some IDX listings have been excluded from this website.
Based on information submitted to the MLS GRID. All data is obtained from various sources and may not have been verified by broker or MLS GRID. Supplied Open House Information is subject to change without notice. All information should be independently reviewed and verified for accuracy. Properties may or may not be listed by the office/agent presenting the information. Some IDX listings have been excluded from this website.
The Digital Millennium Copyright Act of 1998, 17 U.S.C. § 512 (the “DMCA”) provides recourse for copyright owners who believe that material appearing on the Internet infringes their rights under U.S. copyright law. If you believe in good faith that any content or material made available in connection with our website or services infringes your copyright, you (or your agent) may send us a notice requesting that the content or material be removed, or access to it blocked.
Notices must be sent in writing by email to DMCAnotice@MLSGrid.com.
The DMCA requires that your notice of alleged copyright infringement include the following information:
(1) description of the copyrighted work that is the subject of claimed infringement;
(2) description of the alleged infringing content and information sufficient to permit us to locate the content;
(3) contact information for you, including your address, telephone number and email address;
(4) a statement by you that you have a good faith belief that the content in the manner complained of is not authorized by the copyright owner, or its agent, or by the operation of any law;
(5) a statement by you, signed under penalty of perjury, that the information in the notification is accurate and that you have the authority to enforce the copyrights that are claimed to be infringed; and
(6) a physical or electronic signature of the copyright owner or a person authorized to act on the copyright owner’s behalf. Failure to include all of the above information may result in the delay of the processing of your complaint.
- 806 Brandon Hollow Rd
- 151 Rileys Bend Rd
- 0 Flat Creek Hwy
- 2751 Lynchburg Hwy
- 4430 Griffin Rd
- 4669 Griffin Rd
- 830 Bobo Hollow Rd
- 702 Williamson Hollow Rd
- 3773 Griffin Rd
- 0 Haley Ln
- 191 Cedar Ridge Ln
- 44 Moore Ln
- 487 County Line Rd
- 1155 Hurricane Creek Rd
- 2738 Hurricane Creek Rd
- 1190 Flat Creek Hwy
- 4581 Lynchburg Hwy
- 77 Lynchburg Hwy
- 274 Main St
- 0 Smith Chapel Dr Unit RTC2942027
- 69 Hasty Hollow Rd
- 100 Blue Ridge Ave
- 463 Evans Dr
- 117 Wallace Dr
- 1001 Hurricane Rd
- 2485 Pleasant Grove Rd
- 1215 Bel Aire Dr
- 609 Stone Blvd
- 218 Greenfield Ave
- 706 Westside Dr
- 734 Ridgelawn Place
- 742 Ridgelawn Place
- 911 Mckellar Dr
- 940 Mckellar Dr
- 100 Lasalle Ln
- 1315 Cedar Ln Unit B102
- 1315 Cedar Ln Unit B101
- 517 Weaver St Unit 4
- 306 Chestnut Alley
- 127 W Lincoln St Unit 103
