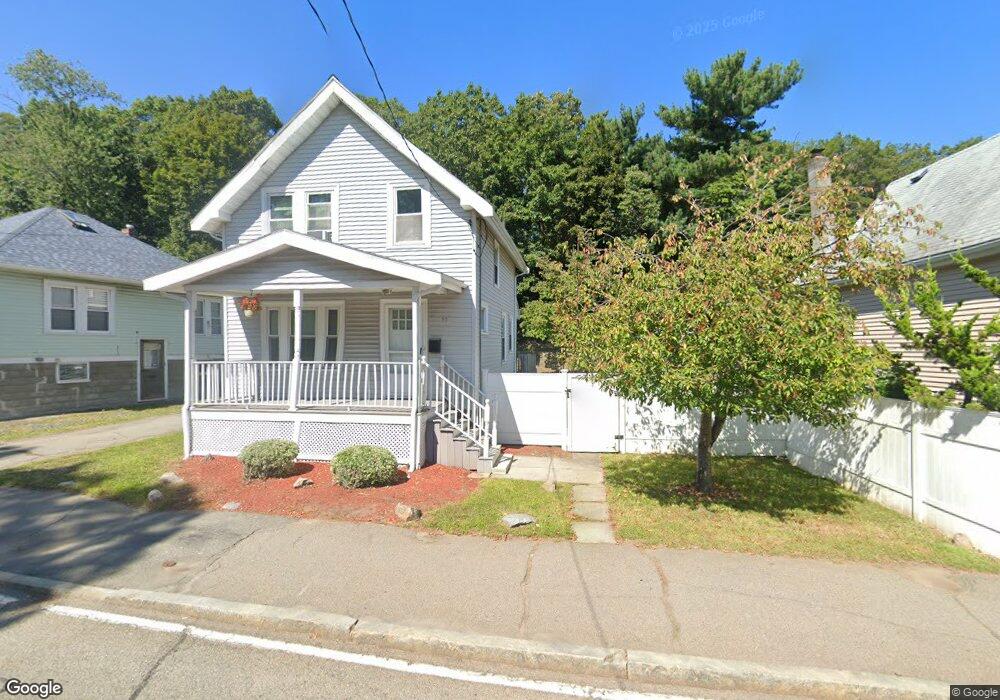
53 Quarry St Quincy, MA 02169
Quincy Center NeighborhoodEstimated Value: $554,000 - $680,000
3
Beds
1
Bath
977
Sq Ft
$624/Sq Ft
Est. Value
About This Home
This home is located at 53 Quarry St, Quincy, MA 02169 and is currently estimated at $609,641, approximately $623 per square foot. 53 Quarry St is a home located in Norfolk County with nearby schools including Lincoln-Hancock Community School, South West Middle School, and Quincy High School.
Ownership History
Date
Name
Owned For
Owner Type
Purchase Details
Closed on
Jan 13, 2016
Sold by
Eaton Francis A and Eaton Ruth M
Bought by
Eaton Ft
Current Estimated Value
Purchase Details
Closed on
Dec 9, 2015
Sold by
Eaton Ft
Bought by
Eaton Francis A and Eaton Ruth M
Purchase Details
Closed on
Jul 20, 2004
Sold by
Eaton Francis A and Eaton Ruth M
Bought by
Eaton Ft
Purchase Details
Closed on
Jun 22, 2004
Sold by
Eaton Ft
Bought by
Eaton Francis A and Eaton Ruth M
Purchase Details
Closed on
May 24, 1989
Sold by
Boyages James
Bought by
Eaton Francis A
Home Financials for this Owner
Home Financials are based on the most recent Mortgage that was taken out on this home.
Original Mortgage
$135,800
Interest Rate
10.99%
Mortgage Type
Purchase Money Mortgage
Create a Home Valuation Report for This Property
The Home Valuation Report is an in-depth analysis detailing your home's value as well as a comparison with similar homes in the area
Home Values in the Area
Average Home Value in this Area
Purchase History
| Date | Buyer | Sale Price | Title Company |
|---|---|---|---|
| Eaton Ft | -- | -- | |
| Eaton Francis A | -- | -- | |
| Eaton Ft | -- | -- | |
| Eaton Francis A | -- | -- | |
| Eaton Francis A | $143,000 | -- |
Source: Public Records
Mortgage History
| Date | Status | Borrower | Loan Amount |
|---|---|---|---|
| Previous Owner | Eaton Francis A | $160,000 | |
| Previous Owner | Eaton Francis A | $148,750 | |
| Previous Owner | Eaton Francis A | $135,800 |
Source: Public Records
Tax History Compared to Growth
Tax History
| Year | Tax Paid | Tax Assessment Tax Assessment Total Assessment is a certain percentage of the fair market value that is determined by local assessors to be the total taxable value of land and additions on the property. | Land | Improvement |
|---|---|---|---|---|
| 2025 | $5,990 | $519,500 | $310,700 | $208,800 |
| 2024 | $5,600 | $496,900 | $296,100 | $200,800 |
| 2023 | $5,118 | $459,800 | $269,500 | $190,300 |
| 2022 | $5,109 | $426,500 | $245,300 | $181,200 |
| 2021 | $4,890 | $402,800 | $245,300 | $157,500 |
| 2020 | $4,690 | $377,300 | $233,700 | $143,600 |
| 2019 | $4,544 | $362,100 | $220,700 | $141,400 |
| 2018 | $4,646 | $348,300 | $220,700 | $127,600 |
| 2017 | $4,659 | $328,800 | $210,400 | $118,400 |
| 2016 | $4,489 | $312,600 | $200,500 | $112,100 |
| 2015 | $4,428 | $303,300 | $200,500 | $102,800 |
| 2014 | $4,205 | $283,000 | $191,100 | $91,900 |
Source: Public Records
Map
Nearby Homes
- 64 Garfield St Unit B
- 91 Garfield St
- 21 Arthur St
- 12 Arthur Ave
- 14 Arthur Ave
- 76 Scotch Pond Place Unit 76
- 73 Scotch Pond Place
- 51 Brook Rd
- 46 Suomi Rd
- 46 Suomi Rd Unit 46
- 94 Brook Rd Unit 3
- 46-48 Buckley St
- 57 Buckley St
- 118 Brook Rd Unit 2
- 1 Cityview Ln Unit 506
- 1 Cityview Ln Unit 709
- 8 Jackson St Unit B2
- 25 Carrolls Ln
- 211 Copeland St
- 56 Penn St Unit 4
- 47 Quarry St
- 47 Quarry St Unit _
- 47 Quarry St Unit 47
- 47 Quarry St
- 47 Quarry St Unit 1
- 49 Quarry St
- 59 Quarry St
- 63 Quarry St
- 60 Quarry St
- 60 Quarry St
- 60 Quarry St Unit Left
- 48 Quarry St Unit 48
- 48 Quarry St Unit 3
- 48 Quarry St
- 54 Quarry St
- 67 Quarry St
- 16 Kidder St
- 46 Quarry St
- 46 Quarry St Unit 1
- 46 Quarry St Unit A