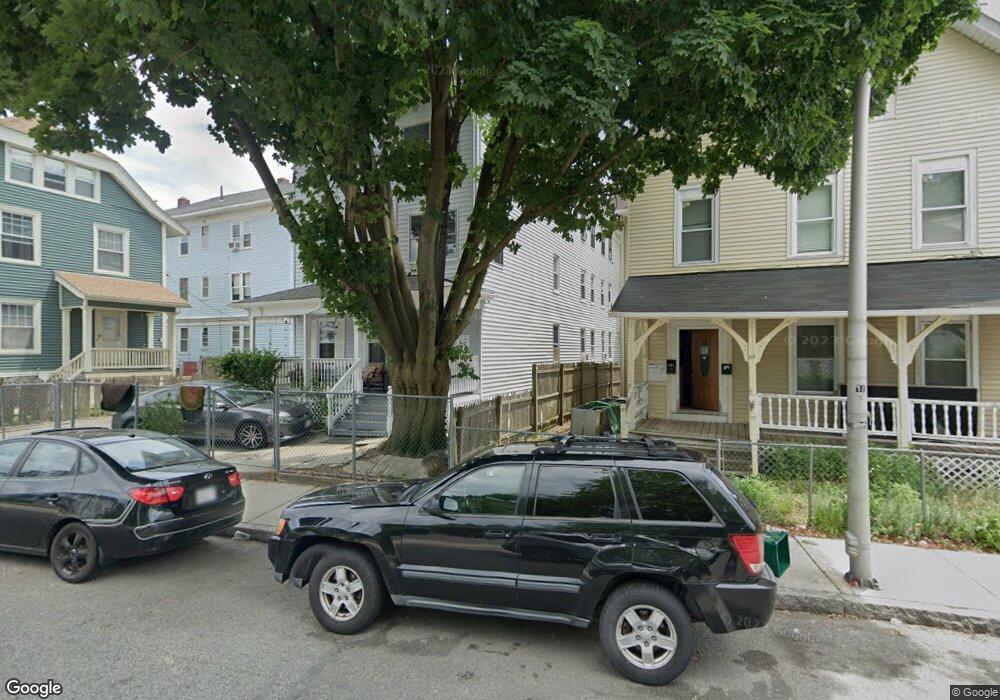
53 Queen St Worcester, MA 01610
University Park NeighborhoodEstimated Value: $710,000 - $828,000
9
Beds
3
Baths
3,874
Sq Ft
$195/Sq Ft
Est. Value
About This Home
This home is located at 53 Queen St, Worcester, MA 01610 and is currently estimated at $753,667, approximately $194 per square foot. 53 Queen St is a home located in Worcester County with nearby schools including Jacob Hiatt Magnet School, Chandler Magnet, and Woodland Academy.
Ownership History
Date
Name
Owned For
Owner Type
Purchase Details
Closed on
Oct 3, 2001
Sold by
Vien Hung and Ngoc Lu
Bought by
Gomez Hector M and Gomez Altagracia
Current Estimated Value
Home Financials for this Owner
Home Financials are based on the most recent Mortgage that was taken out on this home.
Original Mortgage
$153,720
Interest Rate
6.89%
Mortgage Type
Purchase Money Mortgage
Purchase Details
Closed on
May 10, 2001
Sold by
Dao Peter C
Bought by
Vien Hung and Ngoc Lu
Home Financials for this Owner
Home Financials are based on the most recent Mortgage that was taken out on this home.
Original Mortgage
$101,400
Interest Rate
6.88%
Mortgage Type
Purchase Money Mortgage
Purchase Details
Closed on
Aug 23, 2000
Sold by
Tran Hoanh and Dao Peter C
Bought by
Dao Peter C
Purchase Details
Closed on
Jul 31, 1997
Sold by
Reed John E and Martin Joan D
Bought by
Tran Hoanh and Tran An Le
Create a Home Valuation Report for This Property
The Home Valuation Report is an in-depth analysis detailing your home's value as well as a comparison with similar homes in the area
Home Values in the Area
Average Home Value in this Area
Purchase History
| Date | Buyer | Sale Price | Title Company |
|---|---|---|---|
| Gomez Hector M | $155,000 | -- | |
| Vien Hung | $130,000 | -- | |
| Dao Peter C | $51,000 | -- | |
| Tran Hoanh | $51,000 | -- |
Source: Public Records
Mortgage History
| Date | Status | Borrower | Loan Amount |
|---|---|---|---|
| Open | Tran Hoanh | $189,600 | |
| Closed | Tran Hoanh | $153,720 | |
| Previous Owner | Tran Hoanh | $101,400 |
Source: Public Records
Tax History Compared to Growth
Tax History
| Year | Tax Paid | Tax Assessment Tax Assessment Total Assessment is a certain percentage of the fair market value that is determined by local assessors to be the total taxable value of land and additions on the property. | Land | Improvement |
|---|---|---|---|---|
| 2025 | $9,064 | $687,200 | $55,900 | $631,300 |
| 2024 | $8,272 | $601,600 | $55,900 | $545,700 |
| 2023 | $7,906 | $551,300 | $44,900 | $506,400 |
| 2022 | $6,893 | $453,200 | $35,900 | $417,300 |
| 2021 | $6,134 | $376,800 | $28,700 | $348,100 |
| 2020 | $5,403 | $317,800 | $28,800 | $289,000 |
| 2019 | $4,113 | $228,500 | $28,400 | $200,100 |
| 2018 | $4,005 | $211,800 | $28,400 | $183,400 |
| 2017 | $3,738 | $194,500 | $28,400 | $166,100 |
| 2016 | $3,664 | $177,800 | $23,500 | $154,300 |
| 2015 | $3,568 | $177,800 | $23,500 | $154,300 |
| 2014 | $3,474 | $177,800 | $23,500 | $154,300 |
Source: Public Records
Map
Nearby Homes