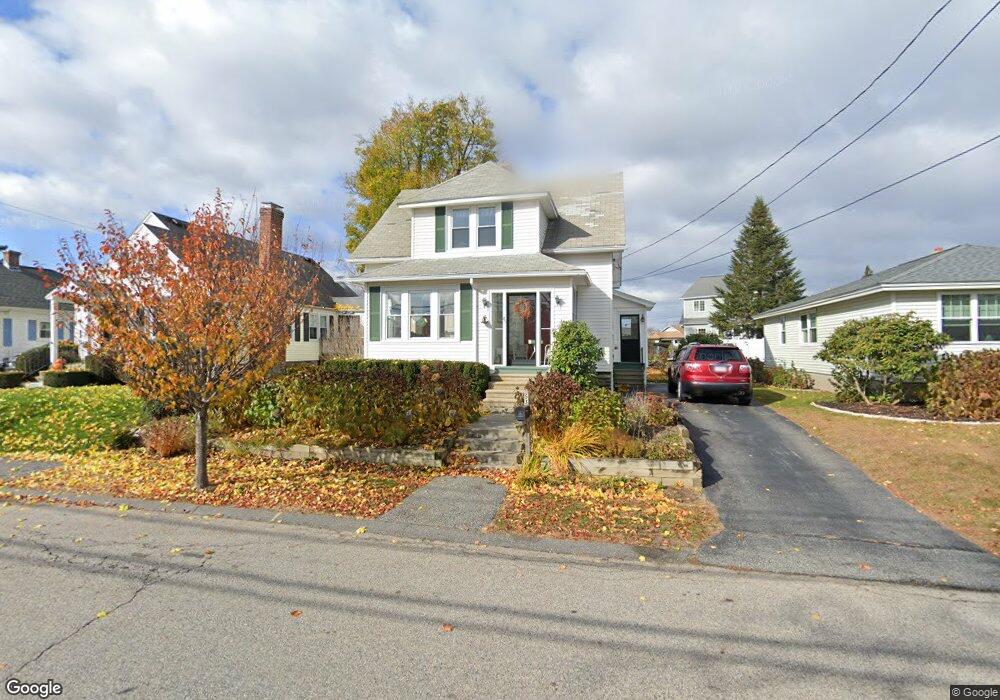
53 Quinapoxet Ln Worcester, MA 01606
Burncoat NeighborhoodEstimated Value: $409,437 - $468,000
3
Beds
2
Baths
1,410
Sq Ft
$307/Sq Ft
Est. Value
About This Home
This home is located at 53 Quinapoxet Ln, Worcester, MA 01606 and is currently estimated at $432,609, approximately $306 per square foot. 53 Quinapoxet Ln is a home located in Worcester County with nearby schools including Belmont Street Community School, Jacob Hiatt Magnet School, and Chandler Magnet.
Ownership History
Date
Name
Owned For
Owner Type
Purchase Details
Closed on
Aug 26, 2009
Sold by
Klinedinst Craig A and Klinedinst Emily N
Bought by
Morgan Kathi
Current Estimated Value
Home Financials for this Owner
Home Financials are based on the most recent Mortgage that was taken out on this home.
Original Mortgage
$216,015
Outstanding Balance
$141,129
Interest Rate
5.17%
Mortgage Type
Purchase Money Mortgage
Estimated Equity
$291,480
Purchase Details
Closed on
Jun 14, 2002
Sold by
Gross-Langlois Linda and Gross Linda A
Bought by
Klinedinst Craig A and Klinedinst Emily N
Home Financials for this Owner
Home Financials are based on the most recent Mortgage that was taken out on this home.
Original Mortgage
$201,400
Interest Rate
6.8%
Mortgage Type
Purchase Money Mortgage
Purchase Details
Closed on
Aug 31, 1999
Sold by
Naughton John J
Bought by
Gross Linda A
Create a Home Valuation Report for This Property
The Home Valuation Report is an in-depth analysis detailing your home's value as well as a comparison with similar homes in the area
Home Values in the Area
Average Home Value in this Area
Purchase History
| Date | Buyer | Sale Price | Title Company |
|---|---|---|---|
| Morgan Kathi | $220,000 | -- | |
| Klinedinst Craig A | $223,800 | -- | |
| Gross Linda A | $139,900 | -- |
Source: Public Records
Mortgage History
| Date | Status | Borrower | Loan Amount |
|---|---|---|---|
| Open | Morgan Kathi | $216,015 | |
| Previous Owner | Gross Linda A | $206,750 | |
| Previous Owner | Gross Linda A | $201,400 | |
| Previous Owner | Gross Linda A | $138,317 |
Source: Public Records
Tax History
| Year | Tax Paid | Tax Assessment Tax Assessment Total Assessment is a certain percentage of the fair market value that is determined by local assessors to be the total taxable value of land and additions on the property. | Land | Improvement |
|---|---|---|---|---|
| 2025 | $4,304 | $326,300 | $90,800 | $235,500 |
| 2024 | $4,197 | $305,200 | $90,800 | $214,400 |
| 2023 | $4,045 | $282,100 | $79,000 | $203,100 |
| 2022 | $3,710 | $243,900 | $63,200 | $180,700 |
| 2021 | $3,547 | $217,900 | $50,600 | $167,300 |
| 2020 | $3,461 | $203,600 | $50,600 | $153,000 |
| 2019 | $3,267 | $181,500 | $45,500 | $136,000 |
| 2018 | $3,245 | $171,600 | $45,500 | $126,100 |
| 2017 | $3,129 | $162,800 | $45,500 | $117,300 |
| 2016 | $3,153 | $153,000 | $34,100 | $118,900 |
| 2015 | $3,071 | $153,000 | $34,100 | $118,900 |
| 2014 | $2,990 | $153,000 | $34,100 | $118,900 |
Source: Public Records
Map
Nearby Homes
- 66 Eunice Ave
- 331 Burncoat St
- 323 Burncoat St
- 30 Danielles Way
- 18 Danielles Way
- 58 Osceola Ave
- 248 Saint Nicholas Ave
- 169 Whitmarsh Ave
- 53 Collins St
- 94 Kendrick Ave
- 39 Whitmarsh Ave
- 3205 Halcyon Dr Unit 3205
- 2101 Halcyon Dr Unit 2101
- 18 Gosnold St
- 15 Ericsson St
- 12 Erie Ave
- 36 Sunrise Ave
- 69 Santoro Rd
- 10 Beale St
- 12 Beale St
- 49 Quinapoxet Ln
- 55 Quinapoxet Ln
- 36 Ascadilla Rd
- 47 Quinapoxet Ln
- 57 Quinapoxet Ln
- 42 Ascadilla Rd
- 28 Ascadilla Rd
- 68 Rowena St
- 60 Quinapoxet Ln
- 11 Inwood Rd
- 26 Ascadilla Rd
- 63 Quinapoxet Ln
- 9 Inwood Rd
- 66 Rowena St
- 20 Ascadilla Rd
- 37 Ascadilla Rd
- 41 Ascadilla Rd
- 40 Quinapoxet Ln
- 33 Ascadilla Rd
- 45 Ascadilla Rd
Your Personal Tour Guide
Ask me questions while you tour the home.