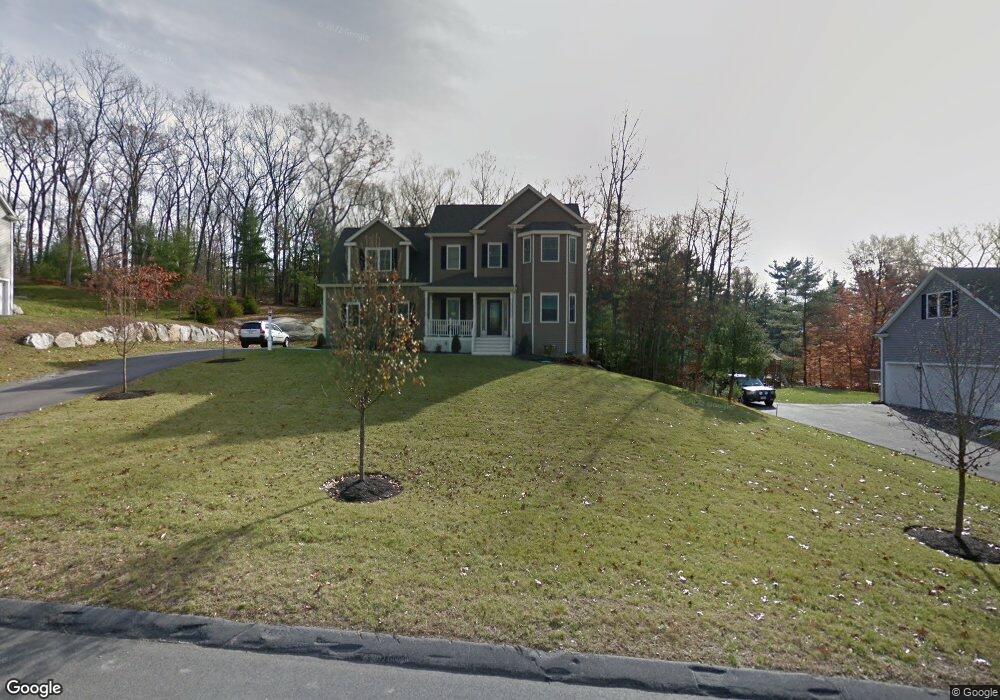
53 Ridge Rd Wrentham, MA 02093
West Wrentham NeighborhoodEstimated Value: $1,038,000 - $1,241,000
4
Beds
3
Baths
3,140
Sq Ft
$353/Sq Ft
Est. Value
About This Home
This home is located at 53 Ridge Rd, Wrentham, MA 02093 and is currently estimated at $1,107,351, approximately $352 per square foot. 53 Ridge Rd is a home located in Norfolk County with nearby schools including Delaney Elementary School, Charles E Roderick, and Rise Prep Mayoral Academy Middle School.
Ownership History
Date
Name
Owned For
Owner Type
Purchase Details
Closed on
Aug 15, 2012
Sold by
Mountain Dog Bldg Corp
Bought by
Vezina Scott and Vezina Victoria
Current Estimated Value
Home Financials for this Owner
Home Financials are based on the most recent Mortgage that was taken out on this home.
Original Mortgage
$532,152
Outstanding Balance
$368,650
Interest Rate
3.67%
Mortgage Type
Purchase Money Mortgage
Estimated Equity
$738,701
Create a Home Valuation Report for This Property
The Home Valuation Report is an in-depth analysis detailing your home's value as well as a comparison with similar homes in the area
Home Values in the Area
Average Home Value in this Area
Purchase History
| Date | Buyer | Sale Price | Title Company |
|---|---|---|---|
| Vezina Scott | $629,900 | -- |
Source: Public Records
Mortgage History
| Date | Status | Borrower | Loan Amount |
|---|---|---|---|
| Open | Vezina Scott | $532,152 |
Source: Public Records
Tax History Compared to Growth
Tax History
| Year | Tax Paid | Tax Assessment Tax Assessment Total Assessment is a certain percentage of the fair market value that is determined by local assessors to be the total taxable value of land and additions on the property. | Land | Improvement |
|---|---|---|---|---|
| 2025 | $11,191 | $965,600 | $323,400 | $642,200 |
| 2024 | $10,657 | $888,100 | $323,400 | $564,700 |
| 2023 | $10,530 | $834,400 | $294,000 | $540,400 |
| 2022 | $9,989 | $730,700 | $267,300 | $463,400 |
| 2021 | $9,781 | $695,200 | $267,300 | $427,900 |
| 2020 | $9,566 | $671,300 | $219,800 | $451,500 |
| 2019 | $9,424 | $667,400 | $235,500 | $431,900 |
| 2018 | $8,578 | $602,400 | $235,800 | $366,600 |
| 2017 | $8,379 | $588,000 | $231,300 | $356,700 |
| 2016 | $8,255 | $578,100 | $224,600 | $353,500 |
| 2015 | $9,262 | $618,300 | $273,500 | $344,800 |
| 2014 | $9,103 | $594,600 | $276,900 | $317,700 |
Source: Public Records
Map
Nearby Homes
- 9 Pebble Cir Unit 9
- 65 Palmetto Dr Unit 65
- 21 Palmetto Dr Unit 21
- 24 Palmetto Dr Unit 24
- 1250 Pulaski Blvd
- 25 Nature View Dr
- 20 Nature View Dr
- 2095 West St
- 142 Stoneham Dr
- 10 Stoneham Dr
- 365 W Wrentham Rd
- 180 Pine Swamp Rd
- 56 Pine Swamp Rd
- 172 Pine Swamp Rd
- 352 Lake St
- 21 Irving St
- 202 Paine St
- 245 W Wrentham Rd
- 194 Paine St
- 45 Lemay Rd