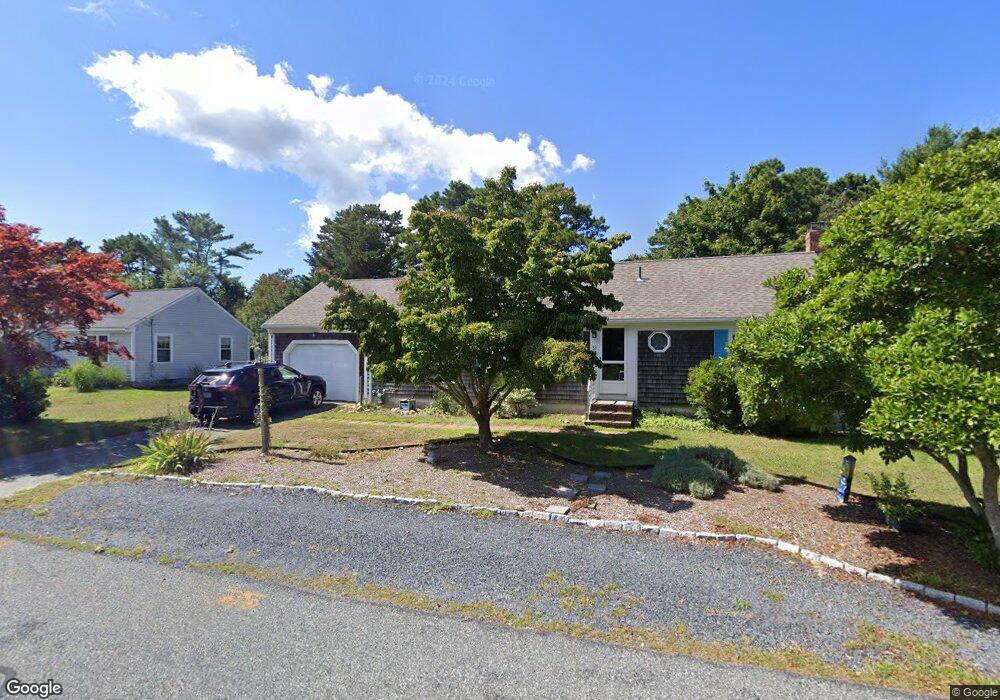
53 Robbin Run South Dennis, MA 02660
East Dennis NeighborhoodEstimated Value: $590,000 - $777,000
3
Beds
2
Baths
1,152
Sq Ft
$564/Sq Ft
Est. Value
About This Home
This home is located at 53 Robbin Run, South Dennis, MA 02660 and is currently estimated at $649,734, approximately $564 per square foot. 53 Robbin Run is a home located in Barnstable County with nearby schools including Dennis-Yarmouth Regional High School and Latham School.
Ownership History
Date
Name
Owned For
Owner Type
Purchase Details
Closed on
Aug 9, 2023
Sold by
Quinn Ft and Quinn
Bought by
Quinn James M and Quinn Robert T
Current Estimated Value
Purchase Details
Closed on
Mar 5, 2018
Sold by
Quinn Mary C
Bought by
Quinn Ft and Quinn
Purchase Details
Closed on
Dec 17, 1984
Bought by
Quinn Mary C
Create a Home Valuation Report for This Property
The Home Valuation Report is an in-depth analysis detailing your home's value as well as a comparison with similar homes in the area
Home Values in the Area
Average Home Value in this Area
Purchase History
| Date | Buyer | Sale Price | Title Company |
|---|---|---|---|
| Quinn James M | -- | None Available | |
| Quinn Ft | -- | -- | |
| Quinn Mary C | $85,000 | -- |
Source: Public Records
Tax History Compared to Growth
Tax History
| Year | Tax Paid | Tax Assessment Tax Assessment Total Assessment is a certain percentage of the fair market value that is determined by local assessors to be the total taxable value of land and additions on the property. | Land | Improvement |
|---|---|---|---|---|
| 2025 | $2,532 | $584,800 | $142,300 | $442,500 |
| 2024 | $2,400 | $546,600 | $136,800 | $409,800 |
| 2023 | $2,385 | $510,800 | $138,200 | $372,600 |
| 2022 | $2,233 | $398,800 | $124,500 | $274,300 |
| 2021 | $2,109 | $349,800 | $122,100 | $227,700 |
| 2020 | $1,930 | $316,400 | $109,800 | $206,600 |
| 2019 | $1,946 | $315,400 | $131,600 | $183,800 |
| 2018 | $1,912 | $301,600 | $136,700 | $164,900 |
| 2017 | $1,823 | $296,400 | $136,700 | $159,700 |
| 2016 | $1,774 | $271,600 | $136,700 | $134,900 |
| 2015 | $1,738 | $271,600 | $136,700 | $134,900 |
| 2014 | $1,725 | $271,600 | $136,700 | $134,900 |
Source: Public Records
Map
Nearby Homes
- 38 Greenland Cir
- 83 Airline Rd
- 4 Landing Ln
- 102 Wildwood Rd
- 360 Airline Rd
- 15 Trudy Cir
- 88 Whiffletree Ave
- 92 Whiffletree Ave
- 25 Black Duck Cartway
- 32 Captain Walsh Dr
- 310 Old Chatham Rd Unit D-30
- 310 Old Chatham Rd Unit A7
- 310 Old Chatham Rd Unit A21
- 310 Old Chatham Rd Unit A-141
- 310 Old Chatham Rd Unit C14
- 0 Canoe Pond Dr
- 1376 Bridge St Unit 16
- 13 Hayfield Rd
- 13 Hayfield Rd
- 432 Old Chatham Rd Unit 403