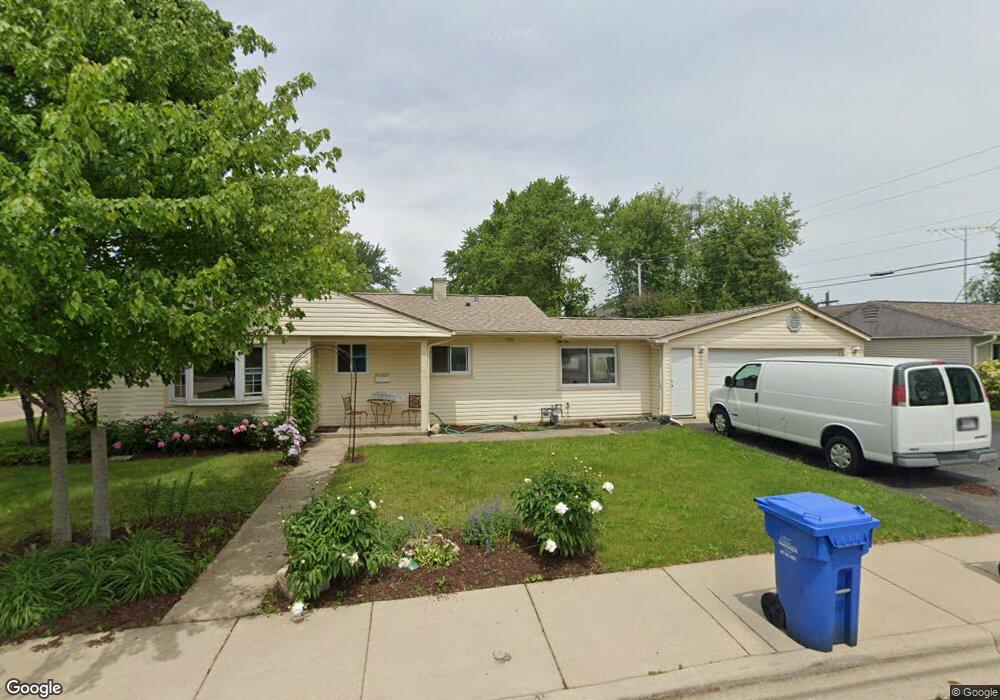
53 Robin Rd Unit 4 Carpentersville, IL 60110
Estimated Value: $222,000 - $265,317
3
Beds
--
Bath
920
Sq Ft
$260/Sq Ft
Est. Value
About This Home
This home is located at 53 Robin Rd Unit 4, Carpentersville, IL 60110 and is currently estimated at $239,329, approximately $260 per square foot. 53 Robin Rd Unit 4 is a home located in Kane County with nearby schools including Meadowdale Elementary School, Carpentersville Middle School, and Dundee-Crown High School.
Ownership History
Date
Name
Owned For
Owner Type
Purchase Details
Closed on
Jan 21, 2000
Sold by
Zimbler Theresa A
Bought by
Zimbler Joseph E
Current Estimated Value
Purchase Details
Closed on
Jul 29, 1994
Sold by
Lawson James L and Lawson Betty L
Bought by
Zimbler Theresa A and Zimbler Joseph E
Home Financials for this Owner
Home Financials are based on the most recent Mortgage that was taken out on this home.
Original Mortgage
$80,828
Interest Rate
8.41%
Mortgage Type
FHA
Create a Home Valuation Report for This Property
The Home Valuation Report is an in-depth analysis detailing your home's value as well as a comparison with similar homes in the area
Home Values in the Area
Average Home Value in this Area
Purchase History
| Date | Buyer | Sale Price | Title Company |
|---|---|---|---|
| Zimbler Joseph E | -- | -- | |
| Zimbler Theresa A | $54,666 | None Available |
Source: Public Records
Mortgage History
| Date | Status | Borrower | Loan Amount |
|---|---|---|---|
| Closed | Zimbler Theresa A | $80,828 |
Source: Public Records
Tax History Compared to Growth
Tax History
| Year | Tax Paid | Tax Assessment Tax Assessment Total Assessment is a certain percentage of the fair market value that is determined by local assessors to be the total taxable value of land and additions on the property. | Land | Improvement |
|---|---|---|---|---|
| 2024 | $4,963 | $73,531 | $12,553 | $60,978 |
| 2023 | $2,635 | $41,356 | $11,295 | $30,061 |
| 2022 | $4,004 | $51,984 | $11,295 | $40,689 |
| 2021 | $3,903 | $49,083 | $10,665 | $38,418 |
| 2020 | $3,835 | $47,979 | $10,425 | $37,554 |
| 2019 | $3,742 | $45,547 | $9,897 | $35,650 |
| 2018 | $3,447 | $42,733 | $9,701 | $33,032 |
| 2017 | $3,280 | $39,975 | $9,075 | $30,900 |
| 2016 | $3,122 | $34,382 | $8,787 | $25,595 |
| 2015 | -- | $27,390 | $8,234 | $19,156 |
| 2014 | -- | $24,638 | $8,007 | $16,631 |
| 2013 | -- | $25,392 | $8,252 | $17,140 |
Source: Public Records
Map
Nearby Homes