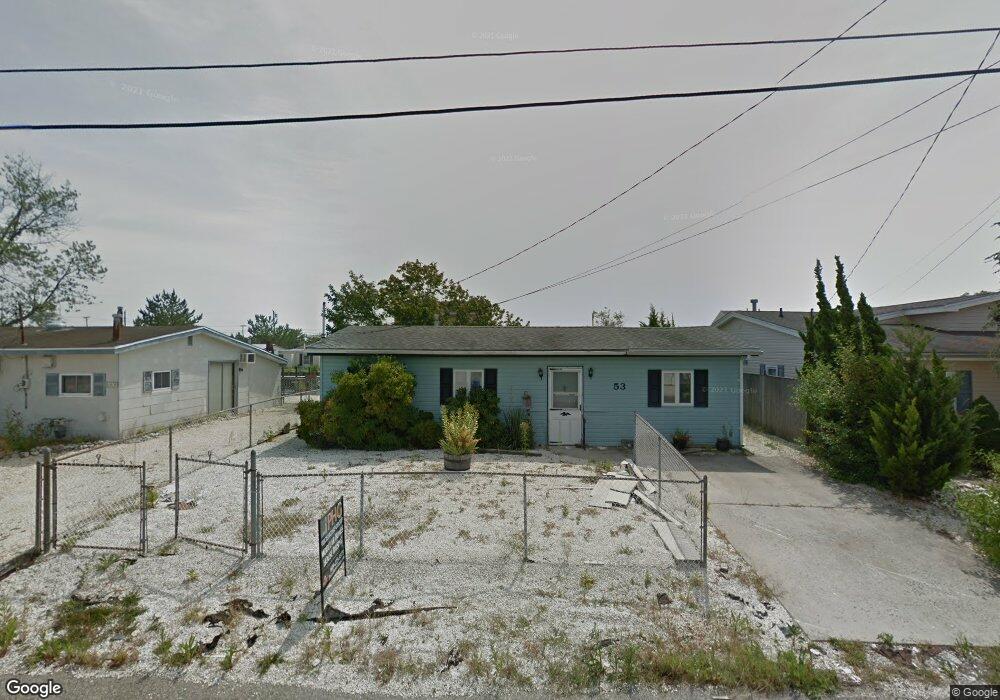
53 Rona Ln Manahawkin, NJ 08050
Stafford NeighborhoodEstimated Value: $862,558 - $1,003,000
3
Beds
3
Baths
1,800
Sq Ft
$523/Sq Ft
Est. Value
About This Home
This home is located at 53 Rona Ln, Manahawkin, NJ 08050 and is currently estimated at $941,390, approximately $522 per square foot. 53 Rona Ln is a home located in Ocean County with nearby schools including Oxycocus Elementary School, Ocean Acres Elementary School, and McKinley Avenue Elementary School.
Ownership History
Date
Name
Owned For
Owner Type
Purchase Details
Closed on
Oct 12, 2015
Sold by
Weiss Richard E and Weiss Janet
Bought by
Weiss William and Weiss Kenneth
Current Estimated Value
Purchase Details
Closed on
Dec 16, 2014
Sold by
Weiss Richard E and Weiss Lillian J
Bought by
Weiss Richard E and Weiss William
Purchase Details
Closed on
Mar 27, 2013
Sold by
Weiss Richard E and Weiss Lillian L
Bought by
Weiss William and Weiss Kenneth
Create a Home Valuation Report for This Property
The Home Valuation Report is an in-depth analysis detailing your home's value as well as a comparison with similar homes in the area
Home Values in the Area
Average Home Value in this Area
Purchase History
| Date | Buyer | Sale Price | Title Company |
|---|---|---|---|
| Weiss William | -- | Attorney | |
| Weiss Richard E | -- | None Available | |
| Weiss Richard E | -- | None Available | |
| Weiss William | -- | None Available |
Source: Public Records
Tax History Compared to Growth
Tax History
| Year | Tax Paid | Tax Assessment Tax Assessment Total Assessment is a certain percentage of the fair market value that is determined by local assessors to be the total taxable value of land and additions on the property. | Land | Improvement |
|---|---|---|---|---|
| 2025 | $9,386 | $378,000 | $156,200 | $221,800 |
| 2024 | $9,295 | $378,000 | $156,200 | $221,800 |
| 2023 | $8,898 | $378,000 | $156,200 | $221,800 |
| 2022 | $8,898 | $378,000 | $156,200 | $221,800 |
| 2021 | $8,777 | $378,000 | $156,200 | $221,800 |
| 2020 | $8,789 | $378,000 | $156,200 | $221,800 |
| 2019 | $8,664 | $378,000 | $156,200 | $221,800 |
| 2018 | $8,611 | $378,000 | $156,200 | $221,800 |
| 2017 | $8,306 | $353,000 | $139,200 | $213,800 |
| 2016 | $3,407 | $146,300 | $139,200 | $7,100 |
| 2015 | $3,287 | $146,300 | $139,200 | $7,100 |
| 2014 | $4,398 | $193,300 | $137,000 | $56,300 |
Source: Public Records
Map
Nearby Homes