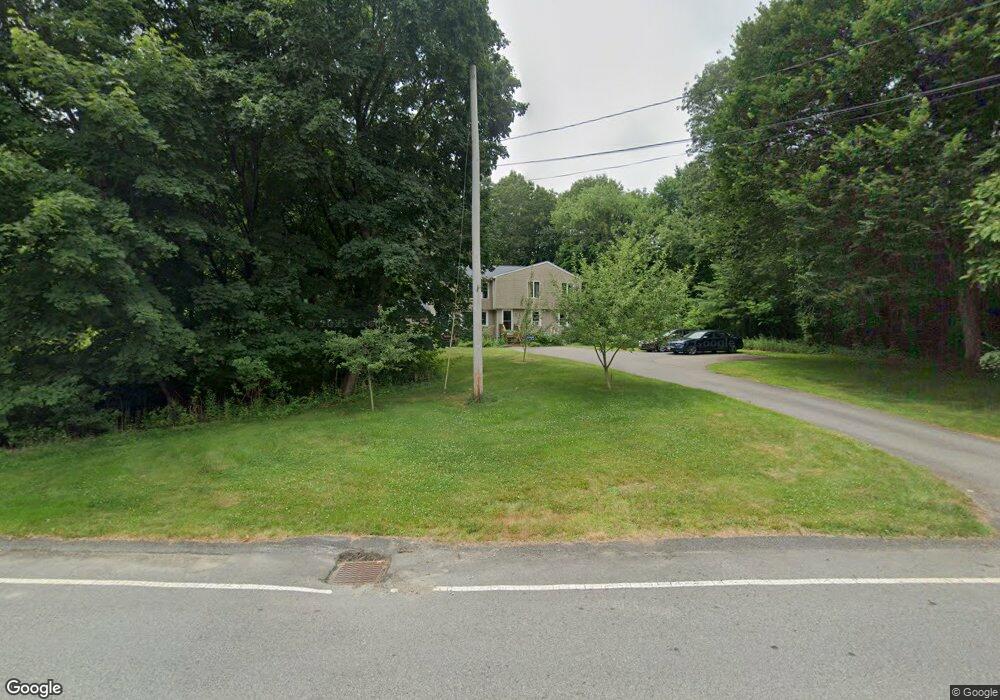
53 Roy Ave Unit B Attleboro, MA 02703
Estimated Value: $336,000 - $407,000
2
Beds
1
Bath
1,546
Sq Ft
$246/Sq Ft
Est. Value
About This Home
This home is located at 53 Roy Ave Unit B, Attleboro, MA 02703 and is currently estimated at $380,233, approximately $245 per square foot. 53 Roy Ave Unit B is a home located in Bristol County with nearby schools including Hill-Roberts Elementary School, Robert J. Coelho Middle School, and Attleboro High School.
Ownership History
Date
Name
Owned For
Owner Type
Purchase Details
Closed on
Dec 9, 2005
Sold by
Cmnty Dev For Attl
Bought by
Robbins Theresa M
Current Estimated Value
Home Financials for this Owner
Home Financials are based on the most recent Mortgage that was taken out on this home.
Original Mortgage
$126,000
Outstanding Balance
$69,994
Interest Rate
6.17%
Mortgage Type
Purchase Money Mortgage
Estimated Equity
$310,239
Create a Home Valuation Report for This Property
The Home Valuation Report is an in-depth analysis detailing your home's value as well as a comparison with similar homes in the area
Home Values in the Area
Average Home Value in this Area
Purchase History
| Date | Buyer | Sale Price | Title Company |
|---|---|---|---|
| Robbins Theresa M | $140,000 | -- |
Source: Public Records
Mortgage History
| Date | Status | Borrower | Loan Amount |
|---|---|---|---|
| Open | Robbins Theresa M | $126,000 |
Source: Public Records
Tax History
| Year | Tax Paid | Tax Assessment Tax Assessment Total Assessment is a certain percentage of the fair market value that is determined by local assessors to be the total taxable value of land and additions on the property. | Land | Improvement |
|---|---|---|---|---|
| 2025 | $4,197 | $334,400 | $0 | $334,400 |
| 2024 | $3,865 | $303,600 | $0 | $303,600 |
| 2023 | $3,703 | $270,500 | $0 | $270,500 |
| 2022 | $3,417 | $236,500 | $0 | $236,500 |
| 2021 | $3,252 | $219,700 | $0 | $219,700 |
| 2020 | $3,170 | $217,700 | $0 | $217,700 |
| 2019 | $2,965 | $209,400 | $0 | $209,400 |
| 2018 | $2,840 | $191,600 | $0 | $191,600 |
| 2017 | $2,818 | $193,700 | $0 | $193,700 |
| 2016 | $2,761 | $186,300 | $0 | $186,300 |
| 2015 | $2,771 | $188,400 | $0 | $188,400 |
| 2014 | $2,827 | $190,400 | $0 | $190,400 |
Source: Public Records
Map
Nearby Homes
Your Personal Tour Guide
Ask me questions while you tour the home.