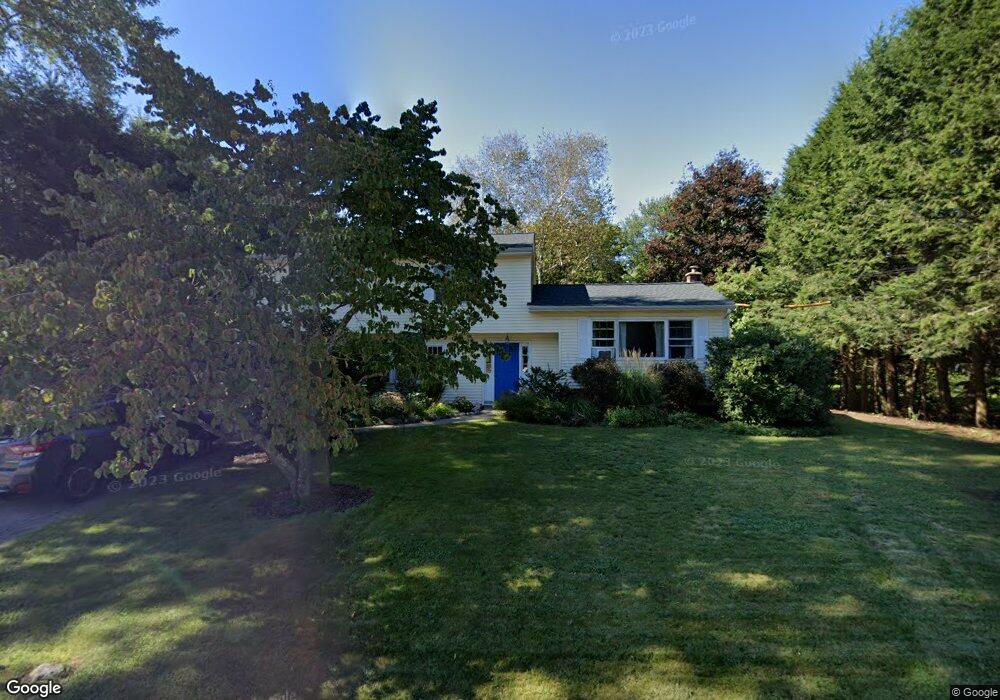
53 Roy Ave Holliston, MA 01746
Holliston AreaEstimated Value: $668,000 - $779,000
About This Home
This home is located at 53 Roy Ave, Holliston, MA 01746 and is currently estimated at $741,467, approximately $351 per square foot. 53 Roy Ave is a home located in Middlesex County with nearby schools including Placentino Elementary School, Miller Elementary School, and Robert H. Adams Middle School.
Ownership History
We collect this data history from publicly available records. To have your information removed, we recommend requesting removal directly through your county’s website.
Purchase Details
Home Values in the Area
Average Home Value in this Area
Purchase History
We collect this data history from publicly available records. To have your information removed, we recommend requesting removal directly through your county’s website.
| Date | Buyer | Sale Price | Title Company |
|---|---|---|---|
| $353,500 | -- |
Mortgage History
We collect this data history from publicly available records. To have your information removed, we recommend requesting removal directly through your county’s website.
| Date | Status | Borrower | Loan Amount |
|---|---|---|---|
| Open | $255,200 |
Tax History
We collect this data history from publicly available records. To have your information removed, we recommend requesting removal directly through your county’s website.
| Year | Tax Paid | Tax Assessment Tax Assessment Total Assessment is a certain percentage of the fair market value that is determined by local assessors to be the total taxable value of land and additions on the property. | Land | Improvement |
|---|---|---|---|---|
| 2025 | $9,416 | $642,700 | $269,600 | $373,100 |
| 2024 | $8,711 | $578,400 | $269,600 | $308,800 |
| 2023 | $8,706 | $565,300 | $269,600 | $295,700 |
| 2022 | $8,469 | $487,300 | $269,600 | $217,700 |
| 2021 | $8,298 | $464,900 | $247,200 | $217,700 |
| 2020 | $7,889 | $418,500 | $244,900 | $173,600 |
| 2019 | $7,845 | $416,600 | $213,100 | $203,500 |
| 2018 | $7,778 | $416,600 | $213,100 | $203,500 |
| 2017 | $7,621 | $411,500 | $205,000 | $206,500 |
| 2016 | $7,215 | $384,000 | $179,400 | $204,600 |
| 2015 | $6,901 | $356,100 | $160,300 | $195,800 |
Map
- 54 Jarr Brook Rd
- 65 Woods Crossing
- 3 Danforth Dr
- 57 Wingate Rd
- 55 Concord St
- 135 Locust St
- 40 Maple St
- 120 Mohawk Path
- 152 Turner Rd Unit 38
- 147 Turner Rd Unit 73
- 31 Robert Rd
- 76 Meeting House Path
- 251 Trailside Way
- 146 Mountain Gate Rd
- 14 Running Brook Cir
- 217 Meeting House Path
- 9 Running Brook Cir
- 73 Trailside Way
- 7 Sherborne Cir
- 1366 Washington St
Ask me questions while you tour the home.