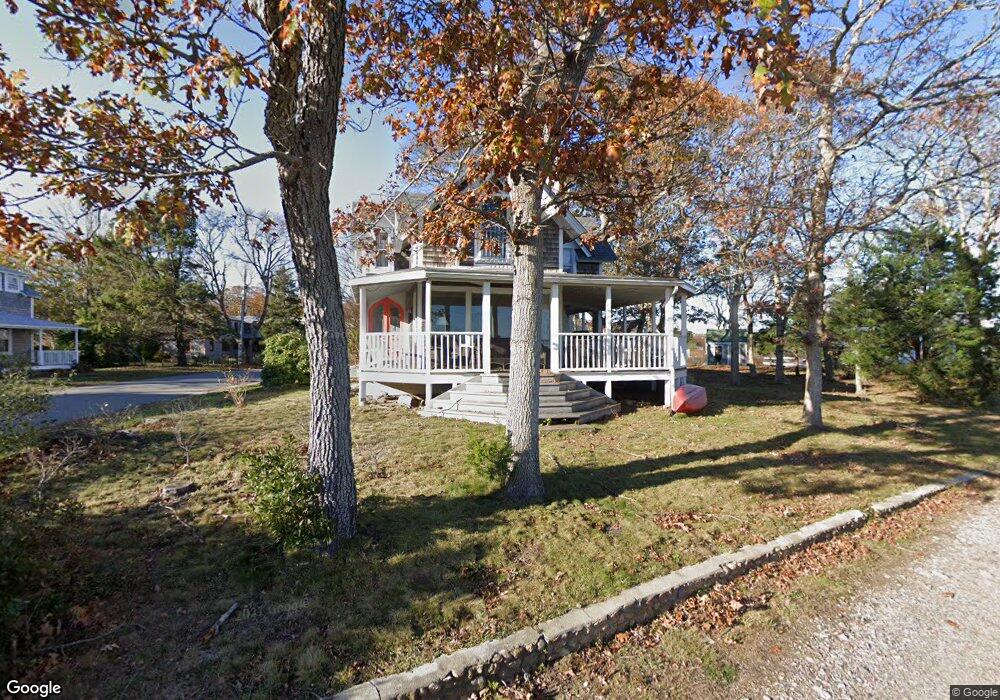
53 S Circuit Ave Oak Bluffs, MA 02557
Oak Bluffs NeighborhoodEstimated Value: $1,619,000 - $2,365,468
3
Beds
2
Baths
1,528
Sq Ft
$1,206/Sq Ft
Est. Value
About This Home
This home is located at 53 S Circuit Ave, Oak Bluffs, MA 02557 and is currently estimated at $1,843,117, approximately $1,206 per square foot. 53 S Circuit Ave is a home with nearby schools including Oak Bluffs Elementary School and Martha's Vineyard Regional High School.
Ownership History
Date
Name
Owned For
Owner Type
Purchase Details
Closed on
Aug 11, 2017
Sold by
Stringfellow Barry G and Kageileiry Jamie F
Bought by
Kageileiry Jamie F
Current Estimated Value
Home Financials for this Owner
Home Financials are based on the most recent Mortgage that was taken out on this home.
Original Mortgage
$775,000
Outstanding Balance
$645,277
Interest Rate
3.88%
Mortgage Type
Unknown
Estimated Equity
$1,197,840
Purchase Details
Closed on
Sep 26, 2003
Sold by
Kageleiry James and Kageleiry Jamie F
Bought by
Stringfellow Barry Gordon and Stringfellow Jamie F
Home Financials for this Owner
Home Financials are based on the most recent Mortgage that was taken out on this home.
Original Mortgage
$150,000
Interest Rate
5.81%
Create a Home Valuation Report for This Property
The Home Valuation Report is an in-depth analysis detailing your home's value as well as a comparison with similar homes in the area
Home Values in the Area
Average Home Value in this Area
Purchase History
| Date | Buyer | Sale Price | Title Company |
|---|---|---|---|
| Kageileiry Jamie F | -- | -- | |
| Stringfellow Barry Gordon | -- | -- |
Source: Public Records
Mortgage History
| Date | Status | Borrower | Loan Amount |
|---|---|---|---|
| Open | Kageileiry Jamie F | $775,000 | |
| Previous Owner | Stringfellow Barry Gordon | $150,000 | |
| Previous Owner | Stringfellow Barry Gordon | $460,000 | |
| Previous Owner | Stringfellow Barry Gordon | $450,000 |
Source: Public Records
Tax History Compared to Growth
Tax History
| Year | Tax Paid | Tax Assessment Tax Assessment Total Assessment is a certain percentage of the fair market value that is determined by local assessors to be the total taxable value of land and additions on the property. | Land | Improvement |
|---|---|---|---|---|
| 2025 | $11,205 | $2,218,900 | $1,527,000 | $691,900 |
| 2024 | $10,717 | $2,049,200 | $1,387,700 | $661,500 |
| 2023 | $10,042 | $1,901,900 | $1,348,300 | $553,600 |
| 2022 | $9,645 | $1,420,500 | $999,200 | $421,300 |
| 2021 | $8,945 | $1,213,700 | $864,100 | $349,600 |
| 2020 | $0 | $1,148,300 | $822,900 | $325,400 |
| 2019 | $0 | $1,037,500 | $717,700 | $319,800 |
| 2018 | $7,590 | $969,300 | $648,100 | $321,200 |
| 2017 | $0 | $891,500 | $604,300 | $287,200 |
| 2016 | $6,024 | $742,800 | $498,400 | $244,400 |
| 2015 | $5,785 | $726,800 | $498,400 | $228,400 |
| 2014 | $6,255 | $800,900 | $567,600 | $233,300 |
Source: Public Records
Map
Nearby Homes
- 50 Canonicus Ave
- 4 Canonicus Ave
- 0 Heather Ln Unit 11 43465
- 181 Circuit Ave
- 113 Dukes County Ave Unit Multi-Family
- 34 Massasoit Ave
- 79 Circuit Ave
- 26 Winthrop Ave
- 1 Cottage Park
- 16 Cottage Park
- 46 Kennebec Ave
- 30 Franklin Ave
- 2 Lincoln Ave
- 41 Trinity Park
- 17 Siloam Ave
- 10 Siloam Ave
- 8 Hitchings Cir
- 22 Greenleaf Ave
- 22 Greenleaf Ave
- 9 Brunswick Ave
- 51 Katama Ave
- 53 Katama Ave
- 49 S Circuit Ave
- 49 Katama Ave
- 42 Katama Ave
- 47 Katama Ave
- 18 Acushnet Ave
- 38 Katama Ave
- 67 S Circuit Ave
- 39 Katama Ave
- 5 Acushnet Ave
- 37 Katama Ave
- 48 Canonicus Ave Unit 1
- 48 Canonicus Ave
- 56 Canonicus Ave
- 42 Canonicus Ave
- 60 Canonicus Ave
- 33 Katama Ave
- 45 Canonicus Ave
- 0 Canonicus Ave