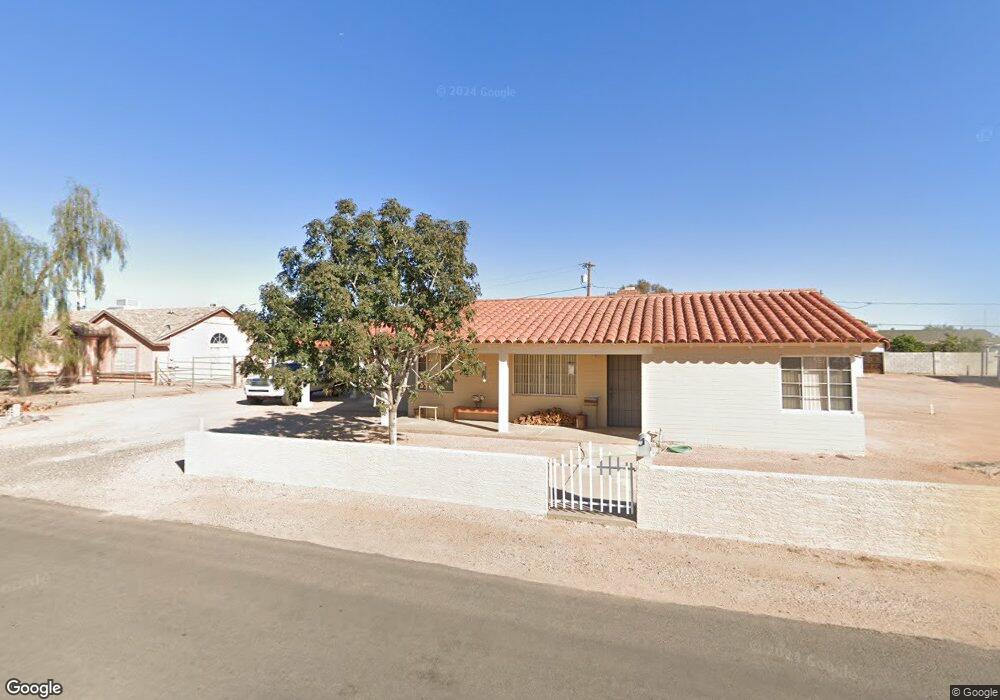
53 S Elmont Dr Apache Junction, AZ 85120
Northeast Mesa NeighborhoodEstimated Value: $285,000 - $378,000
3
Beds
2
Baths
934
Sq Ft
$350/Sq Ft
Est. Value
About This Home
This home is located at 53 S Elmont Dr, Apache Junction, AZ 85120 and is currently estimated at $326,943, approximately $350 per square foot. 53 S Elmont Dr is a home located in Maricopa County with nearby schools including Brinton Elementary School, Franklin at Brimhall Elementary School, and Franklin West Elementary School.
Ownership History
Date
Name
Owned For
Owner Type
Purchase Details
Closed on
Mar 14, 2018
Sold by
Lux Pamela D
Bought by
Lux Pamela D and Smith Sherrell E
Current Estimated Value
Purchase Details
Closed on
May 4, 2006
Sold by
Lux Pamela D and Smith Bonnie L
Bought by
Lux Pamela D and Smith Bonnie L
Purchase Details
Closed on
Nov 6, 2003
Sold by
Smith Bonnie L
Bought by
Lux Pamela D and Smith Bonnie L
Create a Home Valuation Report for This Property
The Home Valuation Report is an in-depth analysis detailing your home's value as well as a comparison with similar homes in the area
Home Values in the Area
Average Home Value in this Area
Purchase History
| Date | Buyer | Sale Price | Title Company |
|---|---|---|---|
| Lux Pamela D | -- | None Available | |
| Lux Pamela D | -- | None Available | |
| Lux Pamela D | -- | None Available | |
| Lux Pamela D | -- | None Available | |
| Lux Pamela D | -- | -- |
Source: Public Records
Tax History
| Year | Tax Paid | Tax Assessment Tax Assessment Total Assessment is a certain percentage of the fair market value that is determined by local assessors to be the total taxable value of land and additions on the property. | Land | Improvement |
|---|---|---|---|---|
| 2025 | $929 | $10,310 | -- | -- |
| 2024 | $940 | $9,819 | -- | -- |
| 2023 | $940 | $29,630 | $5,920 | $23,710 |
| 2022 | $918 | $21,020 | $4,200 | $16,820 |
| 2021 | $915 | $17,360 | $3,470 | $13,890 |
| 2020 | $908 | $14,910 | $2,980 | $11,930 |
| 2019 | $841 | $14,410 | $2,880 | $11,530 |
| 2018 | $820 | $13,180 | $2,630 | $10,550 |
| 2017 | $792 | $11,810 | $2,360 | $9,450 |
| 2016 | $775 | $11,300 | $2,260 | $9,040 |
Source: Public Records
Map
Nearby Homes
- 143 S Mountain Rd
- 53 N Mountain Rd Unit 75
- 11066 E Abilene Ave
- 11100 E Apache Trail Unit 37
- 11100 E Apache Trail
- 11100 E Apache Trail Unit 8
- 11100 E Apache Trail Unit 16
- 11100 E Apache Trail Unit 48
- 11435 E Apache Trail Unit 48
- 11435 E Apache Trail Unit 84
- 301 S Elmont Dr
- 10936 E Apache Trail Unit 121
- 11252 E Boise St
- 724 S Emerald Dr
- 744 S Emerald Dr
- 11311 E 6th Ave
- 11529 E 4th Ave
- 155 S Parkwood
- 11237 E Jupiter Dr
- 11201 E Jupiter Dr
- 51 S Elmont Dr Unit TILE!
- 51 S Elmont Dr
- 59 S Elmont Dr
- 94 S Malcolm Dr
- 90 S Malcolm Dr
- 45 S Elmont Dr
- 56 S Elmont Dr
- 98 S Malcolm Dr
- 109 S Elmont Dr
- 88 S Malcolm Dr
- 62 S Elmont Dr
- 35 S Malcom Dr
- 23 S Elmont Dr
- 112 S Malcolm Dr
- 108 S Elmont Dr
- 55 S Mountain Rd
- 117 S Elmont Dr
- 43 S Malcolm Dr
- 126 S Elmont Dr
- 65 S Mountain Rd
Your Personal Tour Guide
Ask me questions while you tour the home.