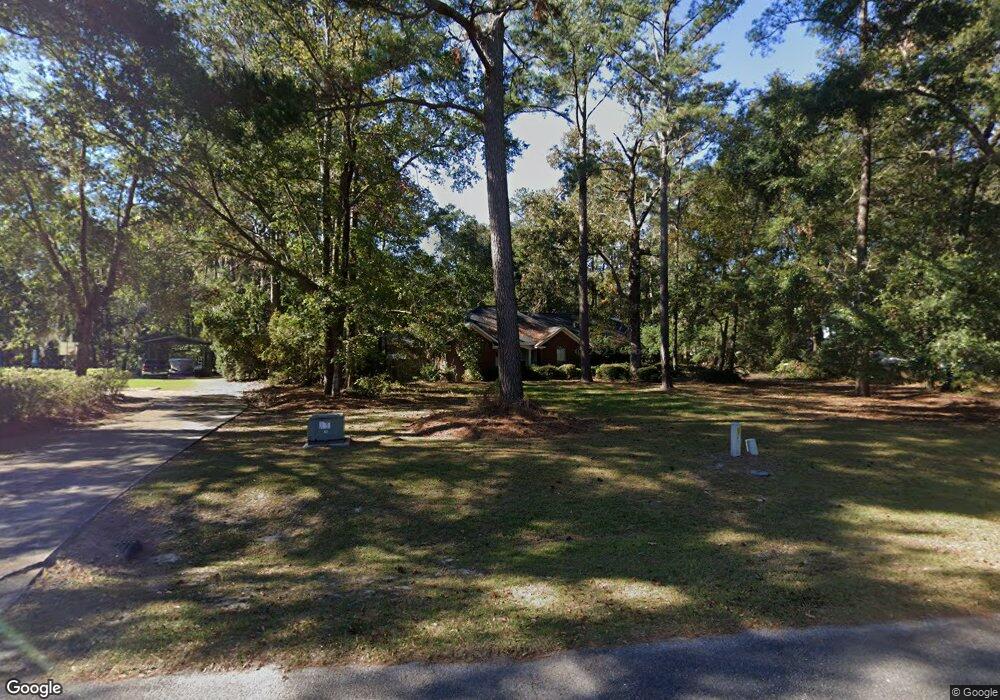
53 Sayle Rd Richmond Hill, GA 31324
Estimated Value: $399,000 - $549,000
3
Beds
3
Baths
1,989
Sq Ft
$225/Sq Ft
Est. Value
About This Home
This home is located at 53 Sayle Rd, Richmond Hill, GA 31324 and is currently estimated at $447,453, approximately $224 per square foot. 53 Sayle Rd is a home located in Bryan County with nearby schools including Frances Meeks Elementary School, Dr. George Washington Carver Elementary School, and Richmond Hill Elementary School.
Ownership History
Date
Name
Owned For
Owner Type
Purchase Details
Closed on
Aug 6, 2025
Sold by
Larcom Kip Charles
Bought by
Green James Joseph
Current Estimated Value
Purchase Details
Closed on
Aug 1, 1997
Sold by
Bryant Cpley A and Bryant Lynn L
Bought by
Larcom Kip C
Purchase Details
Closed on
Sep 1, 1995
Purchase Details
Closed on
Oct 1, 1994
Purchase Details
Closed on
Oct 1, 1992
Purchase Details
Closed on
Sep 1, 1992
Create a Home Valuation Report for This Property
The Home Valuation Report is an in-depth analysis detailing your home's value as well as a comparison with similar homes in the area
Home Values in the Area
Average Home Value in this Area
Purchase History
| Date | Buyer | Sale Price | Title Company |
|---|---|---|---|
| Green James Joseph | -- | -- | |
| Larcom Kip C | $157,000 | -- | |
| -- | $146,500 | -- | |
| -- | $143,000 | -- | |
| -- | $28,000 | -- | |
| -- | -- | -- |
Source: Public Records
Tax History Compared to Growth
Tax History
| Year | Tax Paid | Tax Assessment Tax Assessment Total Assessment is a certain percentage of the fair market value that is determined by local assessors to be the total taxable value of land and additions on the property. | Land | Improvement |
|---|---|---|---|---|
| 2024 | $3,320 | $136,560 | $32,000 | $104,560 |
| 2023 | $3,306 | $105,440 | $32,000 | $73,440 |
| 2022 | $2,641 | $104,040 | $32,000 | $72,040 |
| 2021 | $2,463 | $94,960 | $32,000 | $62,960 |
| 2020 | $2,363 | $94,960 | $32,000 | $62,960 |
| 2019 | $2,509 | $95,320 | $32,000 | $63,320 |
| 2018 | $2,457 | $95,320 | $32,000 | $63,320 |
| 2017 | $2,490 | $102,240 | $29,400 | $72,840 |
| 2016 | $2,430 | $98,840 | $28,000 | $70,840 |
| 2015 | $2,384 | $96,600 | $28,000 | $68,600 |
| 2014 | $2,389 | $96,600 | $28,000 | $68,600 |
Source: Public Records
Map
Nearby Homes