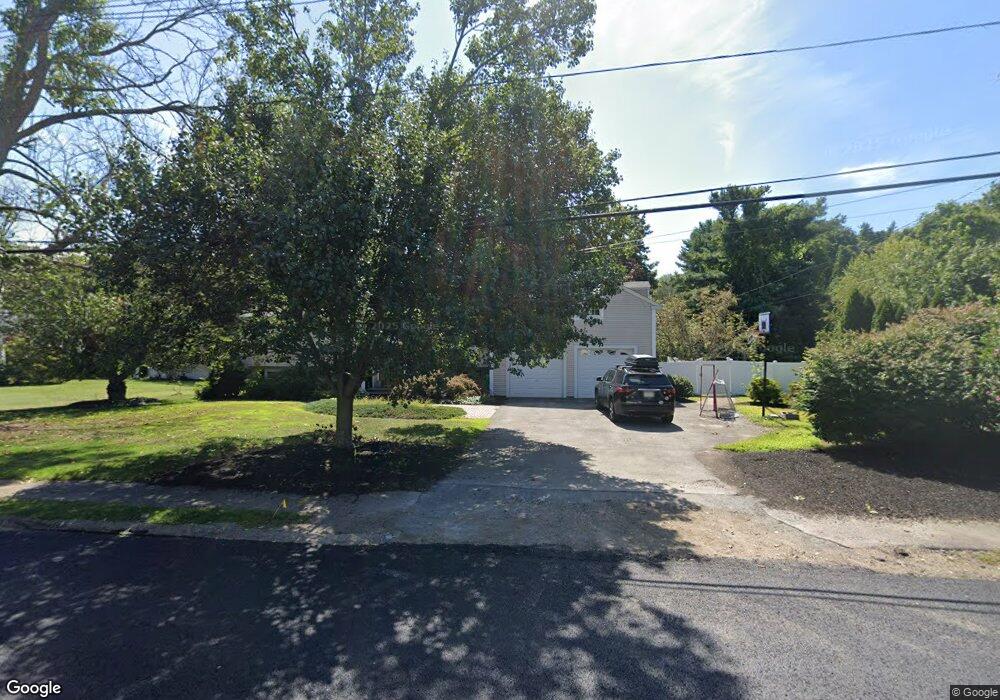
53 Scotland St Hingham, MA 02043
South Hingham NeighborhoodEstimated Value: $1,058,000 - $1,236,000
3
Beds
2
Baths
2,067
Sq Ft
$559/Sq Ft
Est. Value
About This Home
This home is located at 53 Scotland St, Hingham, MA 02043 and is currently estimated at $1,156,475, approximately $559 per square foot. 53 Scotland St is a home located in Plymouth County with nearby schools including South Elementary School, South Shore Charter Public School, and Norwell KinderCare.
Ownership History
Date
Name
Owned For
Owner Type
Purchase Details
Closed on
Jul 30, 2008
Sold by
Lenzi Joseph R and Lenzi Antonia M
Bought by
Pizzelli Dino P and Pizzelli Kara M
Current Estimated Value
Purchase Details
Closed on
Jun 24, 1998
Sold by
Marchesiani Thomas J and Marchesiani Annabella
Bought by
Lenzi Joseph R
Create a Home Valuation Report for This Property
The Home Valuation Report is an in-depth analysis detailing your home's value as well as a comparison with similar homes in the area
Home Values in the Area
Average Home Value in this Area
Purchase History
| Date | Buyer | Sale Price | Title Company |
|---|---|---|---|
| Pizzelli Dino P | $615,000 | -- | |
| Lenzi Joseph R | $227,000 | -- |
Source: Public Records
Mortgage History
| Date | Status | Borrower | Loan Amount |
|---|---|---|---|
| Open | Lenzi Joseph R | $502,047 | |
| Closed | Lenzi Joseph R | $500,610 |
Source: Public Records
Tax History Compared to Growth
Tax History
| Year | Tax Paid | Tax Assessment Tax Assessment Total Assessment is a certain percentage of the fair market value that is determined by local assessors to be the total taxable value of land and additions on the property. | Land | Improvement |
|---|---|---|---|---|
| 2025 | $9,345 | $874,200 | $478,400 | $395,800 |
| 2024 | $9,038 | $833,000 | $478,400 | $354,600 |
| 2023 | $8,063 | $806,300 | $478,400 | $327,900 |
| 2022 | $7,885 | $682,100 | $369,200 | $312,900 |
| 2021 | $7,797 | $660,800 | $369,200 | $291,600 |
| 2020 | $7,560 | $655,700 | $369,200 | $286,500 |
| 2019 | $7,269 | $615,500 | $369,200 | $246,300 |
| 2018 | $7,186 | $610,500 | $369,200 | $241,300 |
| 2017 | $7,715 | $629,800 | $377,600 | $252,200 |
| 2016 | $7,794 | $624,000 | $359,500 | $264,500 |
| 2015 | $7,601 | $606,600 | $342,100 | $264,500 |
Source: Public Records
Map
Nearby Homes
- 4 Richard Rd
- 1088 Main St
- 2 Hoover Rd
- 12 Hoover Rd
- 1 Kerri Ln
- 23 Mast Hill Rd
- 3 Patriots Way
- 15 Pioneer Rd
- 100 Whiting St
- 212 Cushing St
- 18 Whiting Ln
- 214 Washington St Unit 24
- 214 Washington St Unit 28
- 251 Prospect St
- 3 Howland Ln
- 32-70 Lazell St
- 639 Main St
- 2 Black Rock Dr Unit 21
- 2 Black Rock Dr
- 433 Grove St