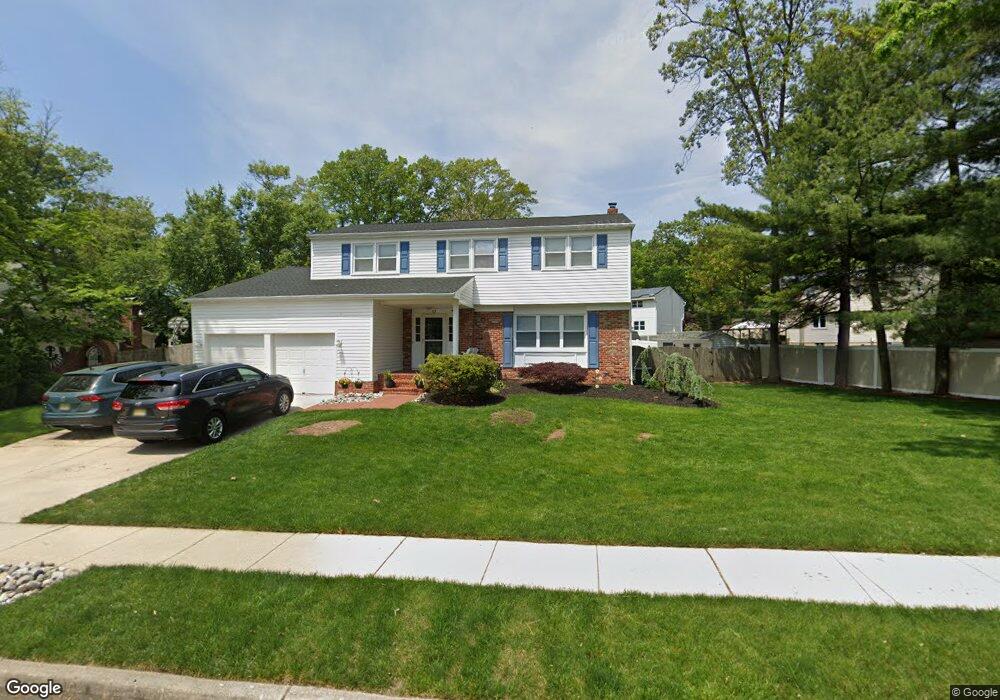
53 Sherry Rd Blackwood, NJ 08012
Washington Township NeighborhoodEstimated Value: $462,971 - $571,000
--
Bed
--
Bath
2,372
Sq Ft
$221/Sq Ft
Est. Value
About This Home
This home is located at 53 Sherry Rd, Blackwood, NJ 08012 and is currently estimated at $523,493, approximately $220 per square foot. 53 Sherry Rd is a home located in Gloucester County with nearby schools including Washington Township High School, Bells Elementary School, and Orchard Valley Middle School.
Ownership History
Date
Name
Owned For
Owner Type
Purchase Details
Closed on
Dec 13, 2002
Sold by
Maisch Robert R and Maisch Cheryl E
Bought by
Bramante John F and Bramante Lisamarie
Current Estimated Value
Home Financials for this Owner
Home Financials are based on the most recent Mortgage that was taken out on this home.
Original Mortgage
$149,600
Outstanding Balance
$63,242
Interest Rate
6.02%
Mortgage Type
Stand Alone First
Estimated Equity
$460,251
Create a Home Valuation Report for This Property
The Home Valuation Report is an in-depth analysis detailing your home's value as well as a comparison with similar homes in the area
Home Values in the Area
Average Home Value in this Area
Purchase History
| Date | Buyer | Sale Price | Title Company |
|---|---|---|---|
| Bramante John F | $187,000 | Weichert Title Agency |
Source: Public Records
Mortgage History
| Date | Status | Borrower | Loan Amount |
|---|---|---|---|
| Open | Bramante John F | $149,600 |
Source: Public Records
Tax History Compared to Growth
Tax History
| Year | Tax Paid | Tax Assessment Tax Assessment Total Assessment is a certain percentage of the fair market value that is determined by local assessors to be the total taxable value of land and additions on the property. | Land | Improvement |
|---|---|---|---|---|
| 2025 | $10,864 | $293,700 | $54,500 | $239,200 |
| 2024 | $10,559 | $293,700 | $54,500 | $239,200 |
| 2023 | $10,559 | $293,700 | $54,500 | $239,200 |
| 2022 | $10,212 | $293,700 | $54,500 | $239,200 |
| 2021 | $7,524 | $293,700 | $54,500 | $239,200 |
| 2020 | $9,930 | $293,700 | $54,500 | $239,200 |
| 2019 | $9,324 | $255,800 | $39,500 | $216,300 |
| 2018 | $9,219 | $255,800 | $39,500 | $216,300 |
| 2017 | $9,104 | $255,800 | $39,500 | $216,300 |
| 2016 | $9,050 | $255,800 | $39,500 | $216,300 |
| 2015 | $8,922 | $255,800 | $39,500 | $216,300 |
| 2014 | $8,641 | $255,800 | $39,500 | $216,300 |
Source: Public Records
Map
Nearby Homes
- 63 Cranford Rd
- 9 Eden Rd
- 12 Palmer Ct
- 4 Fern Rd
- 213 Hurffville Rd
- 102 Trent Rd
- 130 Hurffville Rd
- 26 Sheffield Ln
- 12 Nottingham Way
- 110 Hurffville Rd
- 9 Avon Ct
- 30 Dogwood Ln
- 1 Bently Dr
- 78 Abbington Ln
- 14 Benner Rd
- 102 Forrest Dr
- 7 John Hancock Bldg Unit 7
- 1 Matthew Thornton Bldg
- 74 Greenleigh Dr
- 130 Greentree Rd