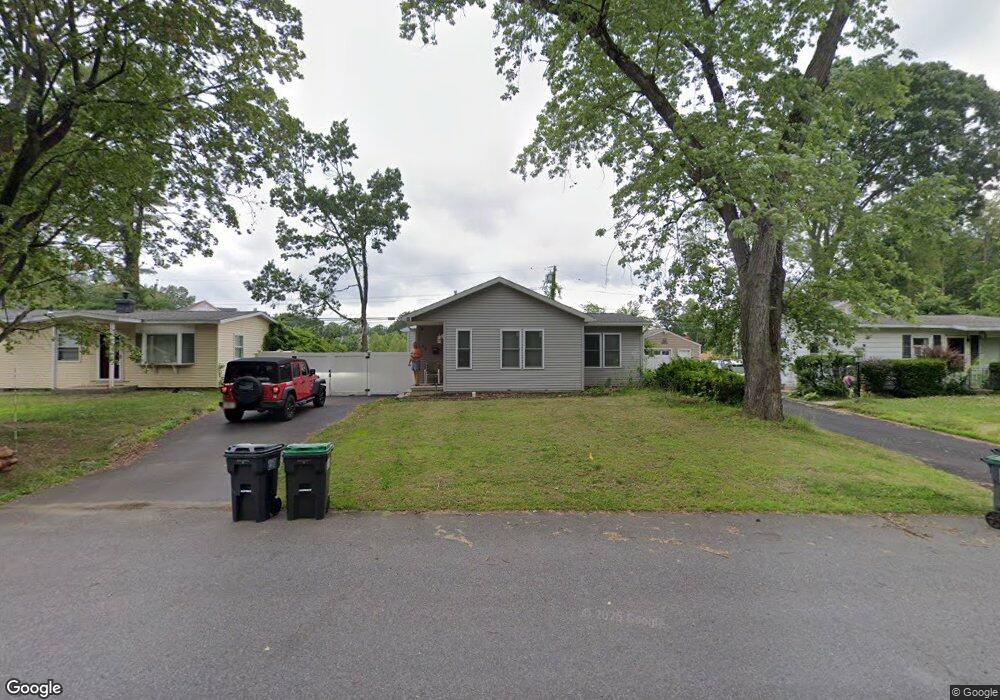
53 Sherwood Dr Latham, NY 12110
Estimated Value: $255,000 - $274,000
3
Beds
1
Bath
1,233
Sq Ft
$216/Sq Ft
Est. Value
About This Home
This home is located at 53 Sherwood Dr, Latham, NY 12110 and is currently estimated at $265,802, approximately $215 per square foot. 53 Sherwood Dr is a home located in Albany County with nearby schools including Southgate School, Shaker Junior High School, and Shaker High School.
Ownership History
Date
Name
Owned For
Owner Type
Purchase Details
Closed on
Jun 15, 2018
Sold by
Cavagnaro Steven and Cavagnaro Diana
Bought by
Centor Michael and Centor Maria
Current Estimated Value
Home Financials for this Owner
Home Financials are based on the most recent Mortgage that was taken out on this home.
Original Mortgage
$1,300,000
Outstanding Balance
$1,124,282
Interest Rate
4.5%
Mortgage Type
New Conventional
Estimated Equity
-$858,480
Purchase Details
Closed on
Jul 11, 2011
Sold by
Plasse Cherri L and Plasse Cheri L
Bought by
Centor Michael
Home Financials for this Owner
Home Financials are based on the most recent Mortgage that was taken out on this home.
Original Mortgage
$126,704
Interest Rate
4.75%
Mortgage Type
FHA
Purchase Details
Closed on
Oct 27, 2004
Sold by
Labombard Robert A
Bought by
Plasse Cherri L
Create a Home Valuation Report for This Property
The Home Valuation Report is an in-depth analysis detailing your home's value as well as a comparison with similar homes in the area
Home Values in the Area
Average Home Value in this Area
Purchase History
| Date | Buyer | Sale Price | Title Company |
|---|---|---|---|
| Centor Michael | $162,500 | None Available | |
| Centor Michael | $130,000 | Chicago Title Insurance Co | |
| Plasse Cherri L | -- | Timothy P Kelleher |
Source: Public Records
Mortgage History
| Date | Status | Borrower | Loan Amount |
|---|---|---|---|
| Open | Centor Michael | $1,300,000 | |
| Previous Owner | Centor Michael | $126,704 |
Source: Public Records
Tax History Compared to Growth
Tax History
| Year | Tax Paid | Tax Assessment Tax Assessment Total Assessment is a certain percentage of the fair market value that is determined by local assessors to be the total taxable value of land and additions on the property. | Land | Improvement |
|---|---|---|---|---|
| 2024 | $3,893 | $88,300 | $22,100 | $66,200 |
| 2023 | $3,798 | $88,300 | $22,100 | $66,200 |
| 2022 | $3,705 | $88,300 | $22,100 | $66,200 |
| 2021 | $3,690 | $88,300 | $22,100 | $66,200 |
| 2020 | $3,125 | $88,300 | $22,100 | $66,200 |
| 2019 | $1,792 | $88,300 | $22,100 | $66,200 |
| 2018 | $3,050 | $88,300 | $22,100 | $66,200 |
| 2017 | $0 | $70,000 | $17,500 | $52,500 |
| 2016 | $2,284 | $70,000 | $17,500 | $52,500 |
| 2015 | -- | $70,000 | $17,500 | $52,500 |
| 2014 | -- | $70,000 | $17,500 | $52,500 |
Source: Public Records
Map
Nearby Homes