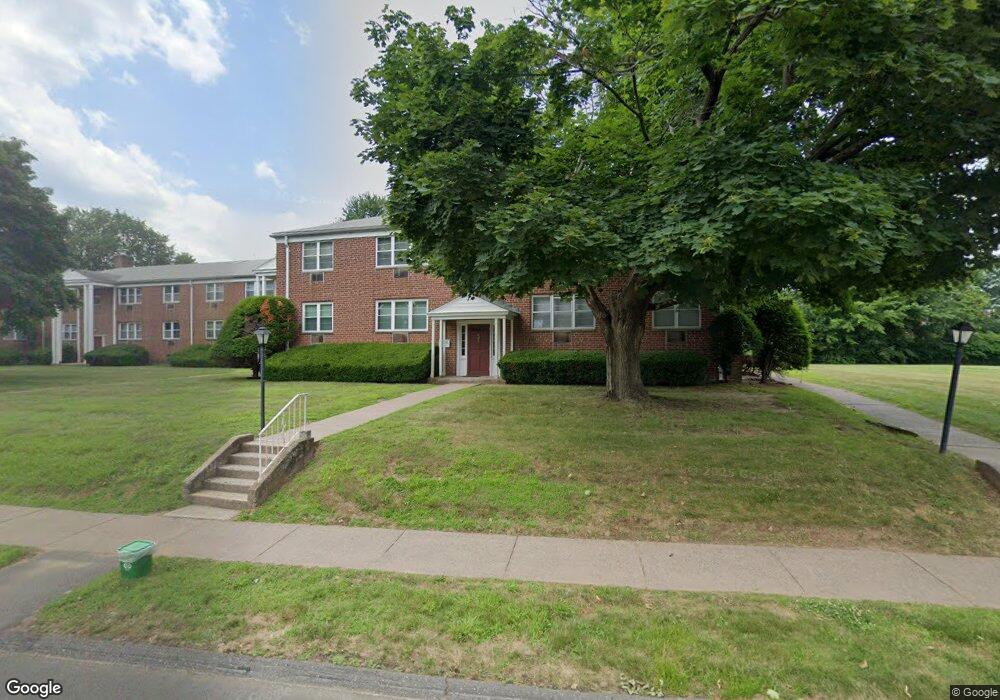
53 Sky View Dr Unit 4 West Hartford, CT 06117
Estimated Value: $209,120 - $242,000
2
Beds
1
Bath
780
Sq Ft
$288/Sq Ft
Est. Value
About This Home
This home is located at 53 Sky View Dr Unit 4, West Hartford, CT 06117 and is currently estimated at $225,030, approximately $288 per square foot. 53 Sky View Dr Unit 4 is a home located in Hartford County with nearby schools including Bugbee School, King Philip Middle School, and Hall High School.
Ownership History
Date
Name
Owned For
Owner Type
Purchase Details
Closed on
Sep 27, 2007
Sold by
Ritger David E and Ritger Joan A
Bought by
Li Yuhong
Current Estimated Value
Home Financials for this Owner
Home Financials are based on the most recent Mortgage that was taken out on this home.
Original Mortgage
$85,000
Outstanding Balance
$54,281
Interest Rate
6.65%
Estimated Equity
$170,749
Purchase Details
Closed on
Jul 16, 1997
Sold by
Thibodeau Stephen and Thibodeau Melinda
Bought by
Sinclair John and Sinclair Milagros
Home Financials for this Owner
Home Financials are based on the most recent Mortgage that was taken out on this home.
Original Mortgage
$98,175
Interest Rate
8.5%
Mortgage Type
Unknown
Purchase Details
Closed on
Jun 19, 1997
Sold by
Stowe Machine Co Inc
Bought by
Stowe Machine Co Inc
Home Financials for this Owner
Home Financials are based on the most recent Mortgage that was taken out on this home.
Original Mortgage
$98,175
Interest Rate
8.5%
Mortgage Type
Unknown
Create a Home Valuation Report for This Property
The Home Valuation Report is an in-depth analysis detailing your home's value as well as a comparison with similar homes in the area
Home Values in the Area
Average Home Value in this Area
Purchase History
| Date | Buyer | Sale Price | Title Company |
|---|---|---|---|
| Li Yuhong | $145,000 | -- | |
| Sinclair John | $130,900 | -- | |
| Stowe Machine Co Inc | $600,000 | -- |
Source: Public Records
Mortgage History
| Date | Status | Borrower | Loan Amount |
|---|---|---|---|
| Open | Stowe Machine Co Inc | $85,000 | |
| Previous Owner | Stowe Machine Co Inc | $98,175 |
Source: Public Records
Tax History Compared to Growth
Tax History
| Year | Tax Paid | Tax Assessment Tax Assessment Total Assessment is a certain percentage of the fair market value that is determined by local assessors to be the total taxable value of land and additions on the property. | Land | Improvement |
|---|---|---|---|---|
| 2025 | $3,868 | $86,380 | $0 | $86,380 |
| 2024 | $3,658 | $86,380 | $0 | $86,380 |
| 2023 | $3,535 | $86,380 | $0 | $86,380 |
| 2022 | $3,514 | $86,380 | $0 | $86,380 |
| 2021 | $3,629 | $85,540 | $0 | $85,540 |
| 2020 | $3,631 | $86,870 | $0 | $86,870 |
| 2019 | $3,631 | $86,870 | $0 | $86,870 |
| 2018 | $3,562 | $86,870 | $0 | $86,870 |
| 2017 | $3,565 | $86,870 | $0 | $86,870 |
| 2016 | $3,573 | $90,440 | $0 | $90,440 |
| 2015 | $3,465 | $90,440 | $0 | $90,440 |
| 2014 | $3,380 | $90,440 | $0 | $90,440 |
Source: Public Records
Map
Nearby Homes
- 62 Blue Ridge Ln
- 30 Farmstead Ln
- 47 Flagg Rd
- 2581 Albany Ave
- 139 Mohawk Dr
- 11 Lawler Rd
- 1294 Trout Brook Dr
- 129 Middlebrook Rd
- 1272 Trout Brook Dr
- 1268 Trout Brook Dr
- 148 King Philip Dr
- 3 Pilgrim Rd
- 132 N Main St
- 56 Fox Chase Ln
- 1196 Trout Brook Dr
- 21 Barksdale Rd
- 320 N Steele Rd
- 3 Trumbull Ln
- 592 Mountain Rd Unit A
- 1993 Albany Ave
- 53 Sky View Dr Unit 3
- 53 Sky View Dr Unit 2
- 53 Sky View Dr Unit 1
- 41 Sky View Dr Unit 4
- 41 Sky View Dr Unit 3
- 41 Sky View Dr Unit 2
- 41 Sky View Dr Unit 1
- 53 Sky View Dr Unit 2B
- 51 Sky View Dr Unit 3
- 51 Sky View Dr Unit 2
- 51 Sky View Dr Unit 1
- 49 Sky View Dr Unit 4
- 49 Sky View Dr Unit 3
- 49 Sky View Dr Unit 2
- 49 Sky View Dr Unit 1
- 47 Sky View Dr Unit 4
- 47 Sky View Dr Unit 3
- 47 Sky View Dr Unit 2
- 45 Sky View Dr Unit 4
- 45 Sky View Dr Unit 3