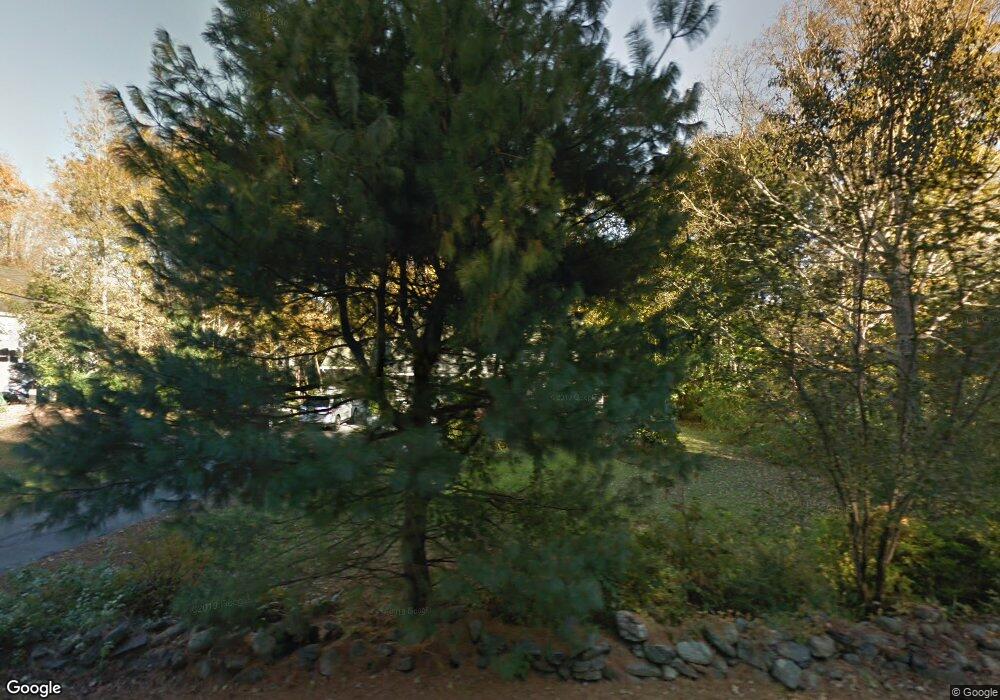
53 South St Northborough, MA 01532
Estimated Value: $602,000 - $697,000
3
Beds
2
Baths
1,690
Sq Ft
$390/Sq Ft
Est. Value
About This Home
This home is located at 53 South St, Northborough, MA 01532 and is currently estimated at $659,414, approximately $390 per square foot. 53 South St is a home located in Worcester County with nearby schools including Marguerite E. Peaslee Elementary School, Robert E. Melican Middle School, and Algonquin Regional High School.
Ownership History
Date
Name
Owned For
Owner Type
Purchase Details
Closed on
Sep 28, 2007
Sold by
South Street Rt and Gagnon Andrea L
Bought by
Towler Erin and Towler Neill
Current Estimated Value
Home Financials for this Owner
Home Financials are based on the most recent Mortgage that was taken out on this home.
Original Mortgage
$256,800
Interest Rate
6.65%
Mortgage Type
Purchase Money Mortgage
Purchase Details
Closed on
Jul 31, 2007
Sold by
Candela Marjorie R
Bought by
South Street Rt and Gagnon Andrea L
Home Financials for this Owner
Home Financials are based on the most recent Mortgage that was taken out on this home.
Original Mortgage
$256,800
Interest Rate
6.65%
Mortgage Type
Purchase Money Mortgage
Purchase Details
Closed on
Nov 2, 2000
Sold by
Benton-Borghi Beatrice and Borghi Peter T
Bought by
Candela Marjorie R
Create a Home Valuation Report for This Property
The Home Valuation Report is an in-depth analysis detailing your home's value as well as a comparison with similar homes in the area
Home Values in the Area
Average Home Value in this Area
Purchase History
| Date | Buyer | Sale Price | Title Company |
|---|---|---|---|
| Towler Erin | $321,000 | -- | |
| South Street Rt | -- | -- | |
| Candela Marjorie R | $242,000 | -- |
Source: Public Records
Mortgage History
| Date | Status | Borrower | Loan Amount |
|---|---|---|---|
| Open | Candela Marjorie R | $249,000 | |
| Closed | Towler Erin | $256,800 | |
| Previous Owner | Candela Marjorie R | $130,000 | |
| Previous Owner | Candela Marjorie R | $65,000 |
Source: Public Records
Tax History Compared to Growth
Tax History
| Year | Tax Paid | Tax Assessment Tax Assessment Total Assessment is a certain percentage of the fair market value that is determined by local assessors to be the total taxable value of land and additions on the property. | Land | Improvement |
|---|---|---|---|---|
| 2025 | $8,124 | $570,100 | $234,700 | $335,400 |
| 2024 | $7,380 | $516,800 | $190,000 | $326,800 |
| 2023 | $7,252 | $490,300 | $179,200 | $311,100 |
| 2022 | $6,941 | $420,900 | $170,600 | $250,300 |
| 2021 | $6,672 | $389,700 | $155,000 | $234,700 |
| 2020 | $6,640 | $384,900 | $155,000 | $229,900 |
| 2019 | $6,083 | $354,700 | $155,000 | $199,700 |
| 2018 | $5,462 | $314,100 | $151,700 | $162,400 |
| 2017 | $5,163 | $296,900 | $151,700 | $145,200 |
| 2016 | $4,919 | $286,500 | $148,300 | $138,200 |
| 2015 | $4,907 | $293,300 | $156,300 | $137,000 |
| 2014 | $4,939 | $297,700 | $156,300 | $141,400 |
Source: Public Records
Map
Nearby Homes
- 71 Summer St
- 5 Swan View Common Dr
- 59 School St Unit A-14
- 89 W Main St
- 90 W Main St
- 19 Crestwood Dr Unit 19
- 132 W Main St
- 39 Pleasant St Unit B19
- 39 Pleasant St Unit C5
- 85 Hudson St Unit 85
- 185-187 South St
- 86 Whitney St
- 26 Maple St
- 198 South St
- 6 Silas Dr
- 223 South St
- 6 Vanessa Dr
- 14 Vanessa Dr
- 105 Lincoln St
- 349 Brigham St
- 59 South St
- 49 South St
- 49 South St Unit M
- 49 South St
- 49 South St Unit 3
- 49 South St Unit 2
- 61 South St
- 72 Summer St
- 76 Summer St
- 70 Summer St
- 69 South St
- 74 Summer St Unit B
- 74A Summer St Unit 1
- 74A Summer St
- 74 Summer St Unit 74B
- 74A Summer St Unit 74A
- 74A Summer St Unit A
- 71 South St
- 41 South St
- 41 South St Unit B