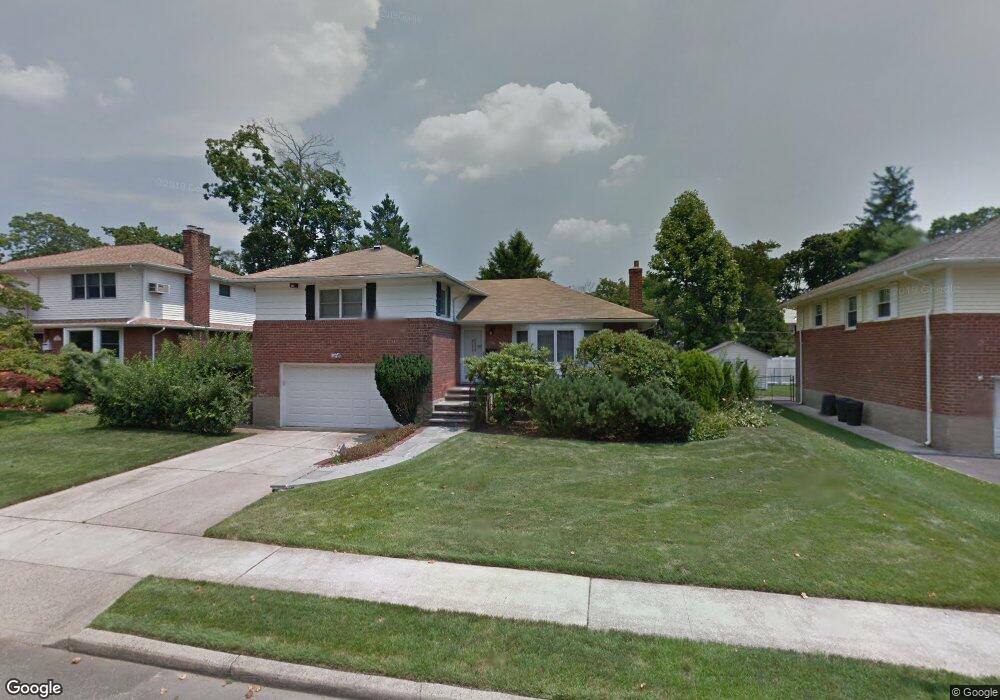
53 Stuart Dr Syosset, NY 11791
Estimated Value: $973,672 - $1,095,000
Studio
2
Baths
1,387
Sq Ft
$746/Sq Ft
Est. Value
About This Home
This home is located at 53 Stuart Dr, Syosset, NY 11791 and is currently estimated at $1,034,336, approximately $745 per square foot. 53 Stuart Dr is a home located in Nassau County with nearby schools including Syosset Senior High School and St Edward Confessor School.
Ownership History
Date
Name
Owned For
Owner Type
Purchase Details
Closed on
Feb 7, 2022
Sold by
Kang Woo Seung and Kwak Lucy Minjung
Bought by
Kang Richard Woosueng and Kwak Lucy Minjung
Current Estimated Value
Home Financials for this Owner
Home Financials are based on the most recent Mortgage that was taken out on this home.
Original Mortgage
$210,000
Outstanding Balance
$193,506
Interest Rate
3.55%
Mortgage Type
New Conventional
Estimated Equity
$840,830
Purchase Details
Closed on
Jun 17, 2003
Sold by
Wang David
Bought by
Kang Woo
Create a Home Valuation Report for This Property
The Home Valuation Report is an in-depth analysis detailing your home's value as well as a comparison with similar homes in the area
Home Values in the Area
Average Home Value in this Area
Purchase History
| Date | Buyer | Sale Price | Title Company |
|---|---|---|---|
| Kang Richard Woosueng | -- | Commonwealth Land Title | |
| Kang Woo | $515,000 | -- |
Source: Public Records
Mortgage History
| Date | Status | Borrower | Loan Amount |
|---|---|---|---|
| Open | Kang Richard Woosueng | $210,000 |
Source: Public Records
Tax History
| Year | Tax Paid | Tax Assessment Tax Assessment Total Assessment is a certain percentage of the fair market value that is determined by local assessors to be the total taxable value of land and additions on the property. | Land | Improvement |
|---|---|---|---|---|
| 2025 | $21,160 | $709 | $353 | $356 |
| 2024 | $6,030 | $709 | $353 | $356 |
Source: Public Records
Map
Nearby Homes
Your Personal Tour Guide
Ask me questions while you tour the home.