Estimated Value: $294,000 - $312,000
2
Beds
3
Baths
1,836
Sq Ft
$164/Sq Ft
Est. Value
About This Home
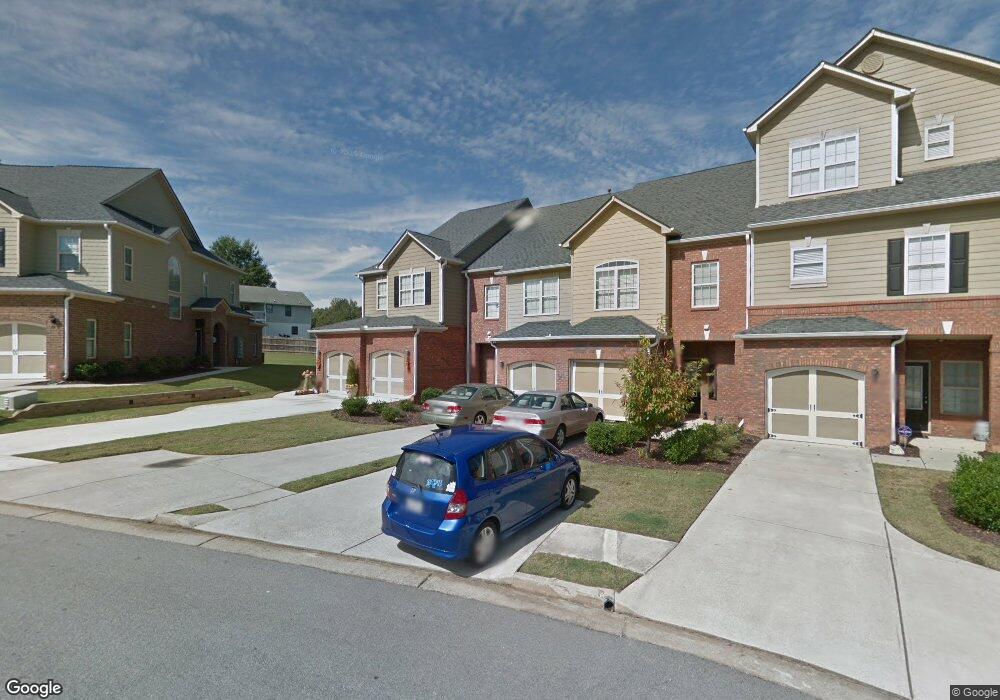
This home is located at 53 Trailside Cir, Hiram, GA 30141 and is currently estimated at $300,440, approximately $163 per square foot. 53 Trailside Cir is a home located in Paulding County with nearby schools including Hiram Elementary School, P. B. Ritch Middle School, and Hiram High School.
Ownership History
Date
Name
Owned For
Owner Type
Purchase Details
Closed on
Mar 26, 2015
Sold by
Jones Michelle M
Current Estimated Value
Purchase Details
Closed on
Jun 17, 2009
Sold by
Jw Ent Investment Group Llc
Bought by
Jones Michelle M
Home Financials for this Owner
Home Financials are based on the most recent Mortgage that was taken out on this home.
Original Mortgage
$117,727
Interest Rate
5.19%
Mortgage Type
FHA
Purchase Details
Closed on
Dec 16, 2008
Sold by
Federal Deposit Ins Corp
Bought by
Jw Ents Investment Group Llc
Purchase Details
Closed on
Jul 1, 2008
Sold by
Craftsman Homes Llc
Purchase Details
Closed on
Jun 3, 2008
Sold by
Craftsman Homes Llc
Bought by
Integrity Bk
Purchase Details
Closed on
Jul 31, 2007
Sold by
Seaboard Township Llc
Purchase Details
Closed on
Jan 29, 2007
Sold by
Silver Comet Communities Llc
Purchase Details
Closed on
Aug 15, 2005
Sold by
Seaboard Township Llc
Create a Home Valuation Report for This Property
The Home Valuation Report is an in-depth analysis detailing your home's value as well as a comparison with similar homes in the area
Home Values in the Area
Average Home Value in this Area
Purchase History
| Date | Buyer | Sale Price | Title Company |
|---|---|---|---|
| -- | -- | -- | |
| Jones Michelle M | $119,900 | -- | |
| Jones Michelle M | $119,900 | -- | |
| Jw Ents Investment Group Llc | $285,000 | -- | |
| -- | $57,000 | -- | |
| -- | -- | -- | |
| Integrity Bk | $82,000 | -- | |
| -- | -- | -- | |
| -- | -- | -- | |
| -- | $29,900 | -- |
Source: Public Records
Mortgage History
| Date | Status | Borrower | Loan Amount |
|---|---|---|---|
| Previous Owner | Jones Michelle M | $117,727 |
Source: Public Records
Tax History
| Year | Tax Paid | Tax Assessment Tax Assessment Total Assessment is a certain percentage of the fair market value that is determined by local assessors to be the total taxable value of land and additions on the property. | Land | Improvement |
|---|---|---|---|---|
| 2025 | $2,957 | $122,956 | $14,000 | $108,956 |
| 2024 | $2,906 | $120,068 | $14,000 | $106,068 |
| 2023 | $3,137 | $122,848 | $14,000 | $108,848 |
| 2022 | $2,559 | $100,048 | $14,000 | $86,048 |
| 2021 | $2,588 | $90,920 | $8,000 | $82,920 |
| 2020 | $2,131 | $73,588 | $8,000 | $65,588 |
| 2019 | $1,898 | $64,852 | $8,000 | $56,852 |
| 2018 | $1,849 | $63,240 | $6,000 | $57,240 |
| 2017 | $1,780 | $60,140 | $6,000 | $54,140 |
| 2016 | $1,500 | $51,460 | $6,000 | $45,460 |
| 2015 | $1,478 | $49,864 | $6,000 | $43,864 |
| 2014 | $1,391 | $45,924 | $6,000 | $39,924 |
| 2013 | -- | $30,160 | $6,000 | $24,160 |
Source: Public Records
Map
Nearby Homes
- 138 Trailside Way
- 208 Trailside Way
- 56 Trailview Ct
- 491 Hiram Douglasville Hwy
- 585 Hiram Douglasville Hwy
- 153 Oak St
- 244 Rosedale Dr
- 329 Hiram Douglasville Hwy
- 263 Hiram Douglasville Hwy
- 277 Oak St
- 72 Hunt St
- 95 Denver Ave
- 264 Denver Ave
- 251 C W Sims Rd
- 371 C W Sims Rd
- 158 Arnold Ln
- 301 C W Sims Rd
- 371 Angham Rd
- 103 S Forty Pass W
- 000 Us Highway 278
- 53 Trailside Cir Unit Lot 13
- 57 Trailside Cir Unit Lot 14
- 57 Trailside Cir
- 59 Trailside Cir Unit Lot 15
- 59 Trailside Cir
- 49 Trailside Cir
- 49 Trailside Cir Unit 49
- 65 Trailside Cir Unit Lot 16
- 65 Trailside Cir Unit 65
- 65 Trailside Cir
- 65 Trailside Cir Unit na
- 67 Trailside Cir
- 47 Trailside Cir Unit 47
- 45 Trailside Cir
- 73 Trailside Cir Unit Lot 18
- 73 Trailside Cir
- 43 Trailside Cir Unit 199
- 43 Trailside Cir Unit 43
- 43 Trailside Cir
- 77 Trailside Cir Unit 682
Your Personal Tour Guide
Ask me questions while you tour the home.