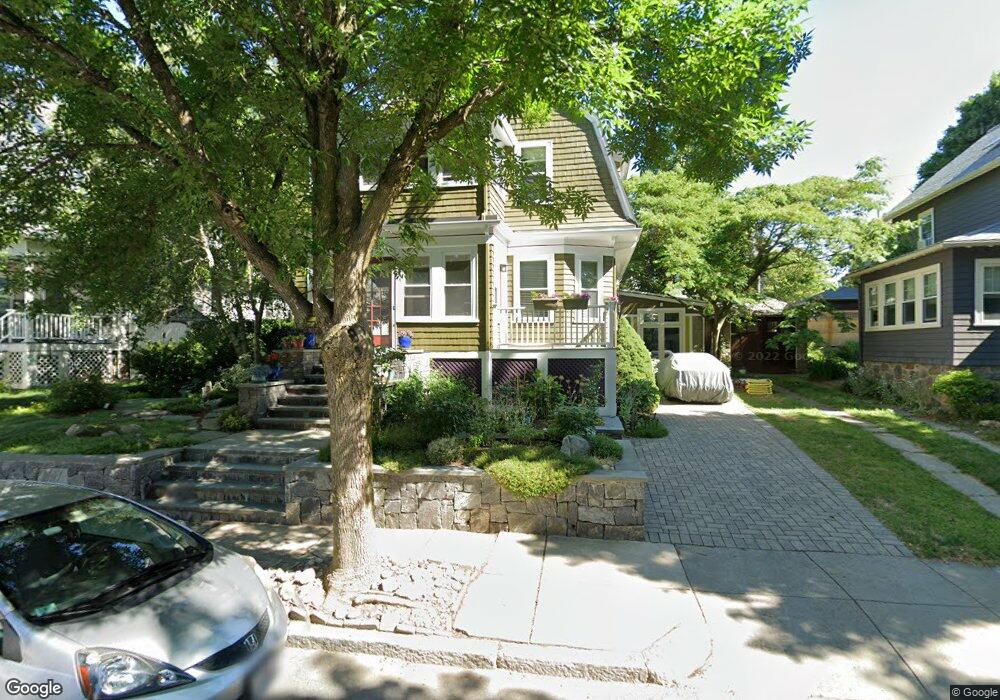
53 Tyndale St Roslindale, MA 02131
Roslindale NeighborhoodEstimated Value: $786,000 - $958,000
3
Beds
2
Baths
1,644
Sq Ft
$530/Sq Ft
Est. Value
About This Home
This home is located at 53 Tyndale St, Roslindale, MA 02131 and is currently estimated at $870,797, approximately $529 per square foot. 53 Tyndale St is a home located in Suffolk County with nearby schools including Brooke Charter School Roslindale, Holy Name Parish School, and Sacred Heart STEM School.
Ownership History
Date
Name
Owned For
Owner Type
Purchase Details
Closed on
Dec 31, 2001
Sold by
Harrington Daniel P and Harrington Nancy J
Bought by
Zigmont James H and Boutelle Teresa
Current Estimated Value
Home Financials for this Owner
Home Financials are based on the most recent Mortgage that was taken out on this home.
Original Mortgage
$222,000
Interest Rate
6.61%
Mortgage Type
Purchase Money Mortgage
Purchase Details
Closed on
Mar 31, 1995
Sold by
Kenney Paul W
Bought by
Harrington Daniel P and Harrington Nancy J
Create a Home Valuation Report for This Property
The Home Valuation Report is an in-depth analysis detailing your home's value as well as a comparison with similar homes in the area
Home Values in the Area
Average Home Value in this Area
Purchase History
| Date | Buyer | Sale Price | Title Company |
|---|---|---|---|
| Zigmont James H | $335,000 | -- | |
| Harrington Daniel P | $112,000 | -- |
Source: Public Records
Mortgage History
| Date | Status | Borrower | Loan Amount |
|---|---|---|---|
| Open | Harrington Daniel P | $220,000 | |
| Closed | Harrington Daniel P | $220,000 | |
| Closed | Harrington Daniel P | $222,000 | |
| Previous Owner | Harrington Daniel P | $150,000 |
Source: Public Records
Tax History Compared to Growth
Tax History
| Year | Tax Paid | Tax Assessment Tax Assessment Total Assessment is a certain percentage of the fair market value that is determined by local assessors to be the total taxable value of land and additions on the property. | Land | Improvement |
|---|---|---|---|---|
| 2025 | $9,089 | $784,900 | $234,900 | $550,000 |
| 2024 | $8,107 | $743,800 | $201,900 | $541,900 |
| 2023 | $7,988 | $743,800 | $201,900 | $541,900 |
| 2022 | $7,213 | $663,000 | $180,300 | $482,700 |
| 2021 | $6,899 | $646,600 | $180,300 | $466,300 |
| 2020 | $6,051 | $573,000 | $168,100 | $404,900 |
| 2019 | $5,572 | $528,700 | $145,500 | $383,200 |
| 2018 | $5,132 | $489,700 | $145,500 | $344,200 |
| 2017 | $5,065 | $478,300 | $145,500 | $332,800 |
| 2016 | $5,108 | $464,400 | $145,500 | $318,900 |
| 2015 | $4,966 | $410,100 | $132,100 | $278,000 |
| 2014 | $4,690 | $372,800 | $132,100 | $240,700 |
Source: Public Records
Map
Nearby Homes
- 26 Bradfield Ave Unit 3
- 15 Newburg St Unit 1
- 242 Belgrade Ave
- 257 Belgrade Ave
- 59 Aldrich St Unit 2
- 17 Metcalf St
- 103 Belgrade Ave Unit 2
- 95 Newburg St
- 311 Belgrade Ave
- 79 Robert St Unit 3
- 112 Roslindale Ave Unit 2
- 80 Roslindale Ave Unit 3
- 15 S Fairview St Unit 3
- 142 Birch St
- 142 Birch St Unit 1
- 142 Birch St Unit 2
- 65 Birch St Unit 3
- 0 Averton St
- 34 Averton St
- 276 Cornell St