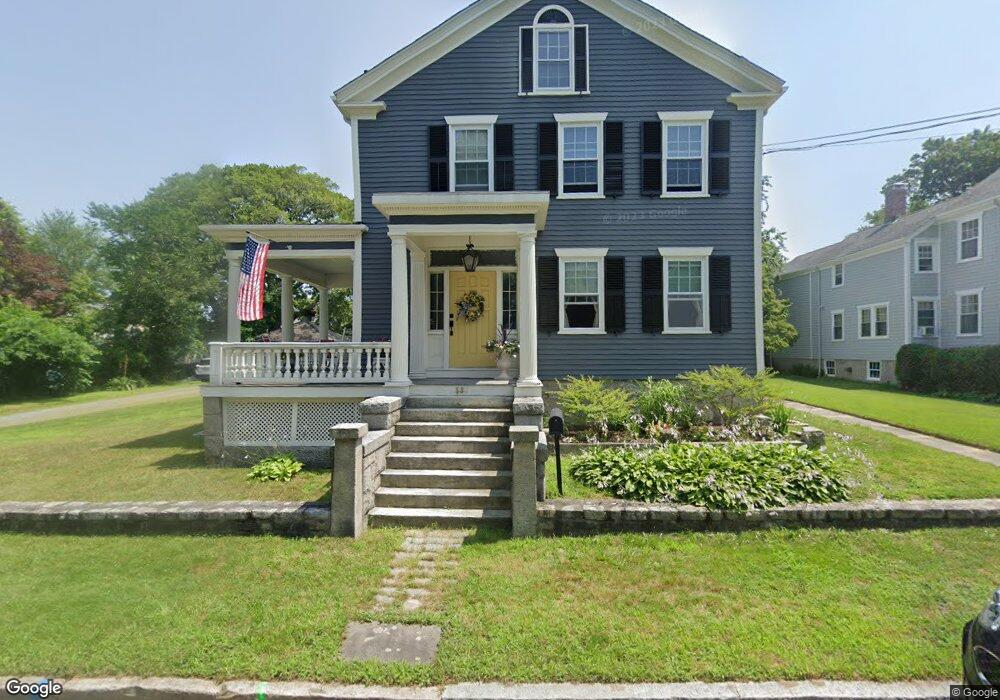
53 Walnut St Fairhaven, MA 02719
Estimated Value: $659,000 - $962,000
4
Beds
3
Baths
3,575
Sq Ft
$215/Sq Ft
Est. Value
About This Home
This home is located at 53 Walnut St, Fairhaven, MA 02719 and is currently estimated at $768,331, approximately $214 per square foot. 53 Walnut St is a home located in Bristol County with nearby schools including Fairhaven High School, City On A Hill Charter Public School New Bedford, and St. Joseph School.
Ownership History
Date
Name
Owned For
Owner Type
Purchase Details
Closed on
Oct 24, 2000
Sold by
Bolduc Richard R
Bought by
Brown Richard H and Brown Christine L
Current Estimated Value
Home Financials for this Owner
Home Financials are based on the most recent Mortgage that was taken out on this home.
Original Mortgage
$110,000
Interest Rate
7.88%
Mortgage Type
Purchase Money Mortgage
Purchase Details
Closed on
Nov 22, 1994
Sold by
Alexion Mark
Bought by
Bolduc Richard R
Home Financials for this Owner
Home Financials are based on the most recent Mortgage that was taken out on this home.
Original Mortgage
$243,000
Interest Rate
8.9%
Mortgage Type
Purchase Money Mortgage
Create a Home Valuation Report for This Property
The Home Valuation Report is an in-depth analysis detailing your home's value as well as a comparison with similar homes in the area
Home Values in the Area
Average Home Value in this Area
Purchase History
| Date | Buyer | Sale Price | Title Company |
|---|---|---|---|
| Brown Richard H | $177,000 | -- | |
| Bolduc Richard R | $140,000 | -- |
Source: Public Records
Mortgage History
| Date | Status | Borrower | Loan Amount |
|---|---|---|---|
| Open | Bolduc Richard R | $270,000 | |
| Closed | Bolduc Richard R | $125,100 | |
| Closed | Bolduc Richard R | $110,000 | |
| Previous Owner | Bolduc Richard R | $243,000 |
Source: Public Records
Tax History
| Year | Tax Paid | Tax Assessment Tax Assessment Total Assessment is a certain percentage of the fair market value that is determined by local assessors to be the total taxable value of land and additions on the property. | Land | Improvement |
|---|---|---|---|---|
| 2025 | $48 | $518,300 | $191,100 | $327,200 |
| 2024 | $4,628 | $501,400 | $191,100 | $310,300 |
| 2023 | $4,647 | $467,000 | $177,200 | $289,800 |
| 2022 | $4,564 | $446,600 | $168,900 | $277,700 |
| 2021 | $4,263 | $377,600 | $153,600 | $224,000 |
| 2020 | $4,100 | $370,700 | $146,700 | $224,000 |
| 2019 | $3,967 | $339,900 | $133,600 | $206,300 |
| 2018 | $5,454 | $325,100 | $127,300 | $197,800 |
| 2017 | $3,793 | $315,000 | $127,300 | $187,700 |
| 2016 | $3,648 | $299,500 | $127,300 | $172,200 |
| 2015 | $3,606 | $296,800 | $127,300 | $169,500 |
Source: Public Records
Map
Nearby Homes