Estimated Value: $445,000 - $480,000
6
Beds
3
Baths
2,666
Sq Ft
$175/Sq Ft
Est. Value
About This Home
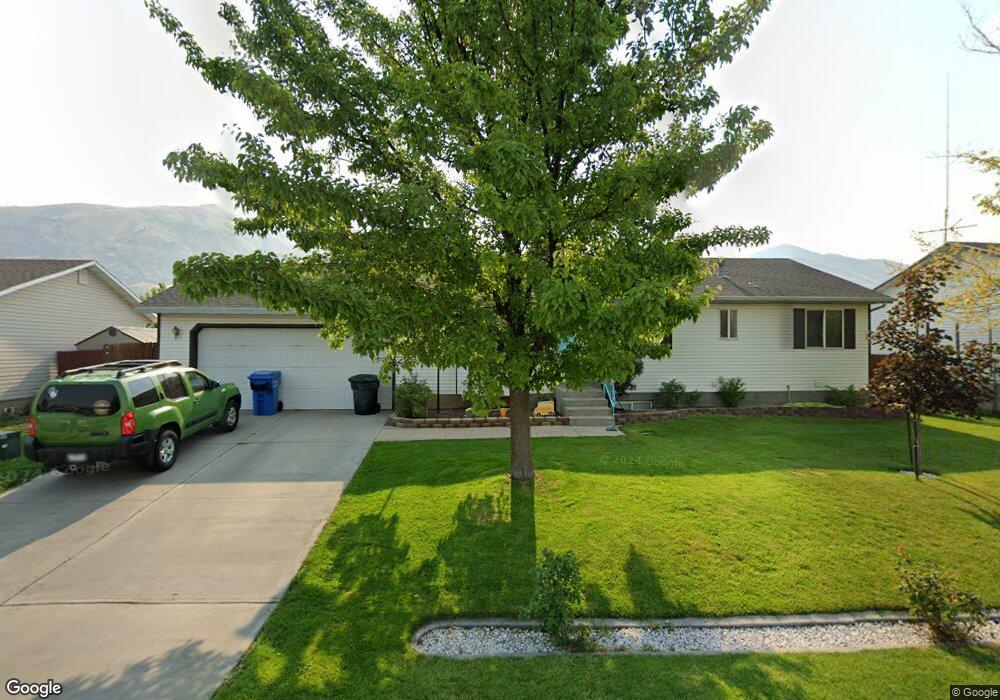
This home is located at 53 Wapiti Loop, Hyrum, UT 84319 and is currently estimated at $465,598, approximately $174 per square foot. 53 Wapiti Loop is a home located in Cache County with nearby schools including Canyon School, South Cache Middle School, and Mountain Crest High School.
Ownership History
Date
Name
Owned For
Owner Type
Purchase Details
Closed on
Dec 5, 2022
Sold by
Drollinger Kevin J and Drollinger Angie L
Bought by
Wolverton Austin and Benson Kenzie
Current Estimated Value
Home Financials for this Owner
Home Financials are based on the most recent Mortgage that was taken out on this home.
Original Mortgage
$422,211
Outstanding Balance
$405,911
Interest Rate
6.25%
Mortgage Type
FHA
Estimated Equity
$59,688
Purchase Details
Closed on
Dec 29, 2008
Sold by
Drollinger Kevin J and Drollinger Angela L
Bought by
Drollinger Kevin J and Drollinger Angie L
Home Financials for this Owner
Home Financials are based on the most recent Mortgage that was taken out on this home.
Original Mortgage
$145,000
Interest Rate
6.03%
Mortgage Type
New Conventional
Purchase Details
Closed on
Sep 19, 2002
Sold by
Drollinger Kevin J and Drollinger Angie
Bought by
Drollinger Kevin J and Drollinger Angela L
Home Financials for this Owner
Home Financials are based on the most recent Mortgage that was taken out on this home.
Original Mortgage
$113,000
Interest Rate
6.24%
Create a Home Valuation Report for This Property
The Home Valuation Report is an in-depth analysis detailing your home's value as well as a comparison with similar homes in the area
Home Values in the Area
Average Home Value in this Area
Purchase History
| Date | Buyer | Sale Price | Title Company |
|---|---|---|---|
| Wolverton Austin | -- | Old Republic Title | |
| Drollinger Kevin J | -- | Hickman Land Title Company | |
| Drollinger Kevin J | -- | Northern Title Company |
Source: Public Records
Mortgage History
| Date | Status | Borrower | Loan Amount |
|---|---|---|---|
| Open | Wolverton Austin | $422,211 | |
| Previous Owner | Drollinger Kevin J | $145,000 | |
| Previous Owner | Drollinger Kevin J | $113,000 |
Source: Public Records
Tax History
| Year | Tax Paid | Tax Assessment Tax Assessment Total Assessment is a certain percentage of the fair market value that is determined by local assessors to be the total taxable value of land and additions on the property. | Land | Improvement |
|---|---|---|---|---|
| 2025 | $1,715 | $246,170 | $0 | $0 |
| 2024 | $1,841 | $246,845 | $0 | $0 |
| 2023 | $1,656 | $212,305 | $0 | $0 |
| 2022 | $1,728 | $212,305 | $0 | $0 |
| 2021 | $1,698 | $321,405 | $63,000 | $258,405 |
| 2020 | $1,565 | $278,050 | $63,000 | $215,050 |
| 2019 | $1,497 | $250,050 | $35,000 | $215,050 |
| 2018 | $1,374 | $222,000 | $35,000 | $187,000 |
| 2017 | $1,345 | $112,750 | $0 | $0 |
| 2016 | $1,376 | $98,285 | $0 | $0 |
| 2015 | $997 | $81,495 | $0 | $0 |
| 2014 | $975 | $81,495 | $0 | $0 |
| 2013 | -- | $81,495 | $0 | $0 |
Source: Public Records
Map
Nearby Homes
Your Personal Tour Guide
Ask me questions while you tour the home.