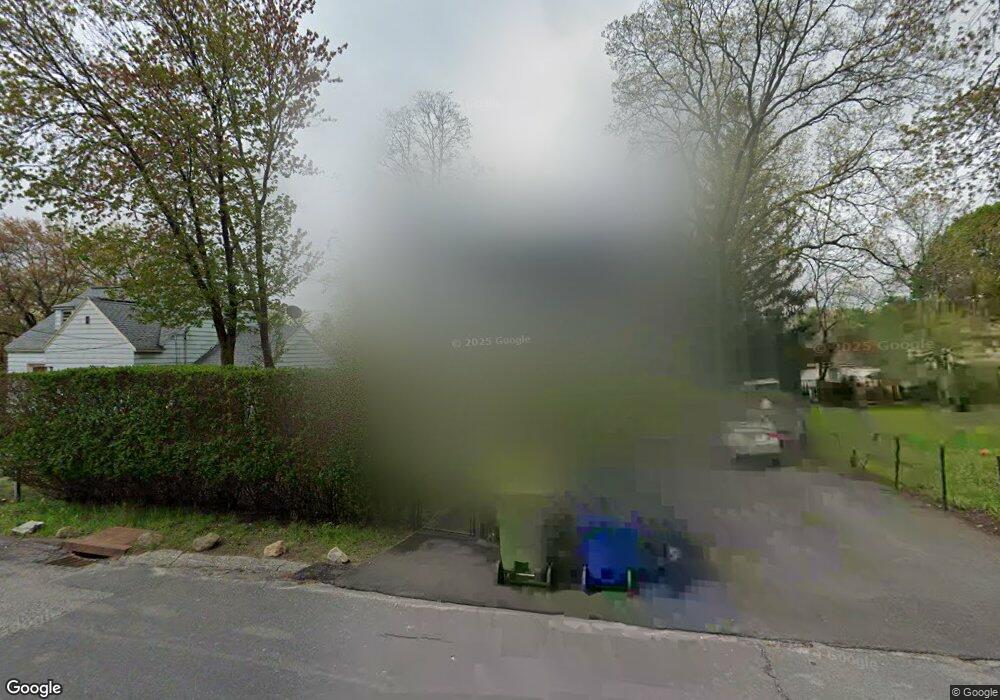
53 Warner St Waterbury, CT 06704
North End District NeighborhoodEstimated Value: $172,000 - $263,000
3
Beds
1
Bath
1,040
Sq Ft
$218/Sq Ft
Est. Value
About This Home
This home is located at 53 Warner St, Waterbury, CT 06704 and is currently estimated at $226,580, approximately $217 per square foot. 53 Warner St is a home located in New Haven County with nearby schools including Woodrow Wilson School, Michael F. Wallace Middle School, and Crosby High School.
Ownership History
Date
Name
Owned For
Owner Type
Purchase Details
Closed on
Mar 5, 2007
Sold by
Ramy Homes Llc
Bought by
Viera Eliel and Rivera Aimee
Current Estimated Value
Home Financials for this Owner
Home Financials are based on the most recent Mortgage that was taken out on this home.
Original Mortgage
$119,900
Outstanding Balance
$72,613
Interest Rate
6.27%
Mortgage Type
Purchase Money Mortgage
Estimated Equity
$153,967
Purchase Details
Closed on
Jul 3, 2006
Sold by
Liquidation Prop Inc
Bought by
Ramy Homes Llc
Purchase Details
Closed on
Jun 30, 2004
Sold by
Ellis Jessie and Ellis Johnnie
Bought by
Davis George
Home Financials for this Owner
Home Financials are based on the most recent Mortgage that was taken out on this home.
Original Mortgage
$55,100
Interest Rate
6.3%
Mortgage Type
Purchase Money Mortgage
Create a Home Valuation Report for This Property
The Home Valuation Report is an in-depth analysis detailing your home's value as well as a comparison with similar homes in the area
Home Values in the Area
Average Home Value in this Area
Purchase History
| Date | Buyer | Sale Price | Title Company |
|---|---|---|---|
| Viera Eliel | $119,900 | -- | |
| Ramy Homes Llc | $65,000 | -- | |
| Davis George | $58,000 | -- |
Source: Public Records
Mortgage History
| Date | Status | Borrower | Loan Amount |
|---|---|---|---|
| Open | Davis George | $119,900 | |
| Previous Owner | Davis George | $55,100 |
Source: Public Records
Tax History Compared to Growth
Tax History
| Year | Tax Paid | Tax Assessment Tax Assessment Total Assessment is a certain percentage of the fair market value that is determined by local assessors to be the total taxable value of land and additions on the property. | Land | Improvement |
|---|---|---|---|---|
| 2025 | $3,870 | $86,030 | $12,740 | $73,290 |
| 2024 | $4,253 | $86,030 | $12,740 | $73,290 |
| 2023 | $4,662 | $86,030 | $12,740 | $73,290 |
| 2022 | $2,895 | $48,080 | $12,750 | $35,330 |
| 2021 | $2,895 | $48,080 | $12,750 | $35,330 |
| 2020 | $2,895 | $48,080 | $12,750 | $35,330 |
| 2019 | $2,895 | $48,080 | $12,750 | $35,330 |
| 2018 | $2,895 | $48,080 | $12,750 | $35,330 |
| 2017 | $3,160 | $52,480 | $12,750 | $39,730 |
| 2016 | $3,160 | $52,480 | $12,750 | $39,730 |
| 2015 | $3,055 | $52,480 | $12,750 | $39,730 |
| 2014 | $3,055 | $52,480 | $12,750 | $39,730 |
Source: Public Records
Map
Nearby Homes