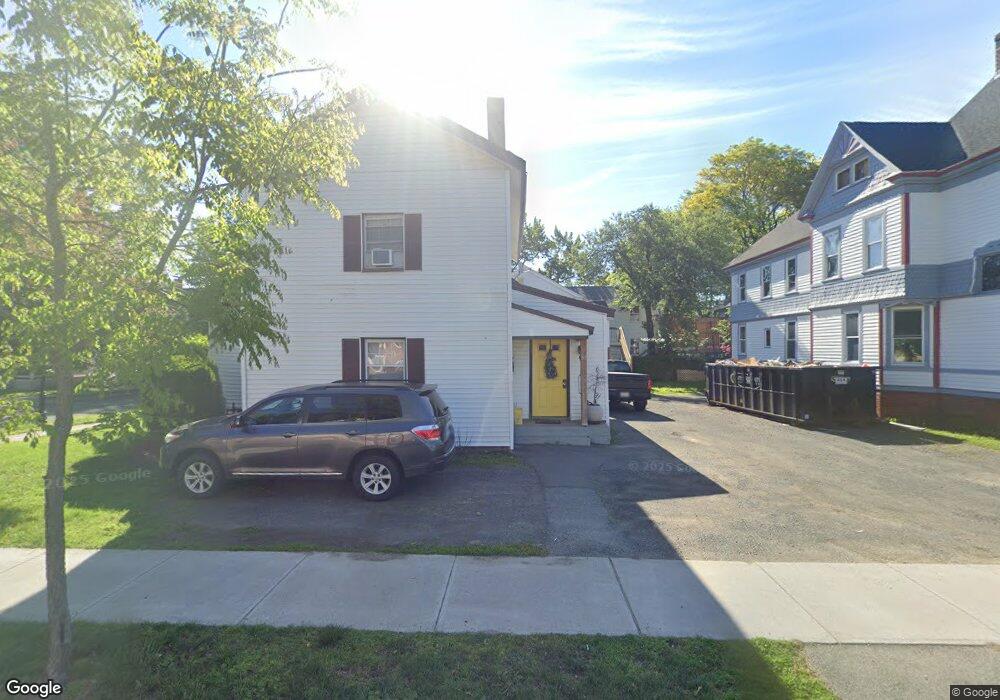
53 Washington St Westfield, MA 01085
Estimated Value: $287,032 - $380,000
6
Beds
2
Baths
2,468
Sq Ft
$129/Sq Ft
Est. Value
About This Home
This home is located at 53 Washington St, Westfield, MA 01085 and is currently estimated at $317,508, approximately $128 per square foot. 53 Washington St is a home located in Hampden County with nearby schools including Westfield High School and Saint Mary High School.
Ownership History
Date
Name
Owned For
Owner Type
Purchase Details
Closed on
Apr 6, 2022
Sold by
Andrews Merritt
Bought by
Westfield Rents Llc
Current Estimated Value
Purchase Details
Closed on
Feb 26, 2010
Sold by
Deutsche Bank Natl T C
Bought by
Andrews Merritt B
Purchase Details
Closed on
Oct 7, 2009
Sold by
Hoynoski William
Bought by
Deutsche Bank Natl T C
Purchase Details
Closed on
Dec 30, 2005
Sold by
Hoynoski Anna E
Bought by
Hoynoski William
Home Financials for this Owner
Home Financials are based on the most recent Mortgage that was taken out on this home.
Original Mortgage
$137,000
Interest Rate
6.39%
Mortgage Type
Purchase Money Mortgage
Purchase Details
Closed on
Dec 29, 1989
Sold by
Williams Robert P
Bought by
Hoynoski Edmond
Create a Home Valuation Report for This Property
The Home Valuation Report is an in-depth analysis detailing your home's value as well as a comparison with similar homes in the area
Home Values in the Area
Average Home Value in this Area
Purchase History
| Date | Buyer | Sale Price | Title Company |
|---|---|---|---|
| Westfield Rents Llc | -- | None Available | |
| Andrews Merritt B | $95,000 | -- | |
| Deutsche Bank Natl T C | $130,000 | -- | |
| Hoynoski William | $190,000 | -- | |
| Hoynoski Edmond | $50,000 | -- |
Source: Public Records
Mortgage History
| Date | Status | Borrower | Loan Amount |
|---|---|---|---|
| Previous Owner | Hoynoski William | $137,000 | |
| Previous Owner | Hoynoski Edmond | $125,000 | |
| Previous Owner | Hoynoski Edmond | $5,000 |
Source: Public Records
Tax History
| Year | Tax Paid | Tax Assessment Tax Assessment Total Assessment is a certain percentage of the fair market value that is determined by local assessors to be the total taxable value of land and additions on the property. | Land | Improvement |
|---|---|---|---|---|
| 2025 | $3,906 | $257,300 | $76,600 | $180,700 |
| 2024 | $3,858 | $241,600 | $69,600 | $172,000 |
| 2023 | $3,637 | $217,700 | $66,400 | $151,300 |
| 2022 | $3,637 | $196,700 | $59,200 | $137,500 |
| 2021 | $3,521 | $186,500 | $55,900 | $130,600 |
| 2020 | $3,390 | $176,100 | $55,900 | $120,200 |
| 2019 | $3,308 | $168,200 | $53,200 | $115,000 |
| 2018 | $2,921 | $150,900 | $53,200 | $97,700 |
| 2017 | $2,880 | $148,300 | $54,000 | $94,300 |
| 2016 | $2,883 | $148,300 | $54,000 | $94,300 |
| 2015 | $2,749 | $148,300 | $54,000 | $94,300 |
| 2014 | $2,696 | $148,300 | $54,000 | $94,300 |
Source: Public Records
Map
Nearby Homes
- 13 Green Ave
- 42R Jefferson St
- 7 Washington St
- 19 Kellogg St
- 4 Belmont St
- 3 Belmont St
- 100 Meadow St
- 63 George St
- 9 Montgomery St
- 16 Squawfield Rd
- 18 Noble St
- 70 S Maple St
- 60 Mill St
- 88 Woodmont St
- 74 S Maple St
- 13 Furrow St
- 105 Montgomery St
- 42 Putnam Dr
- 76 Kane Brothers Cir
- 0 Lockhouse Rd Unit 73473161
Your Personal Tour Guide
Ask me questions while you tour the home.