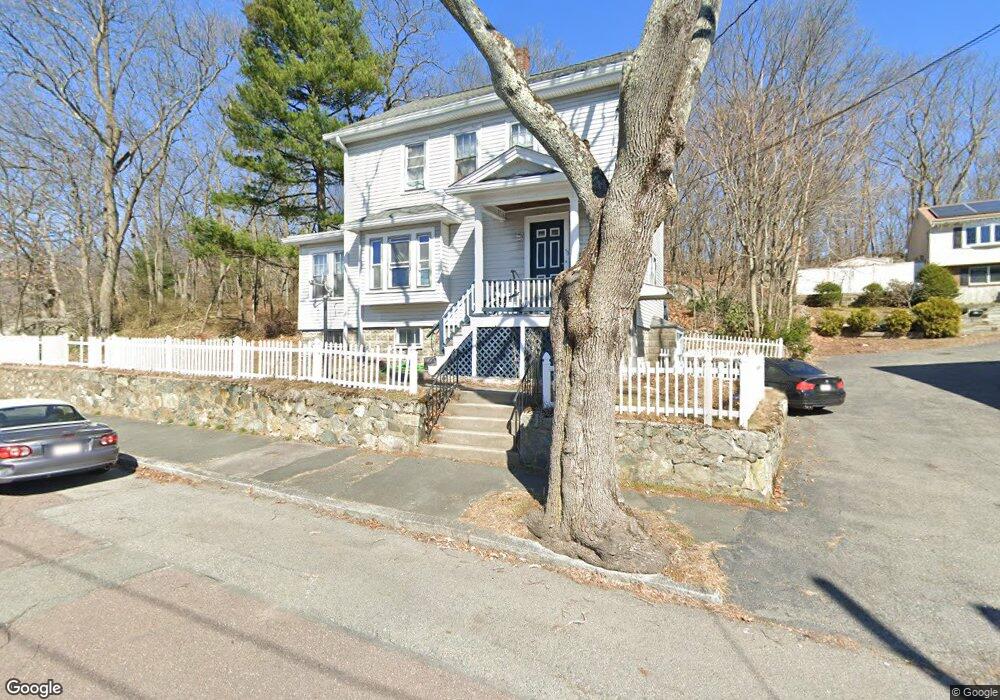
53 Wilbur St Malden, MA 02148
Forestdale NeighborhoodEstimated Value: $710,000 - $787,000
3
Beds
2
Baths
1,786
Sq Ft
$419/Sq Ft
Est. Value
About This Home
This home is located at 53 Wilbur St, Malden, MA 02148 and is currently estimated at $748,675, approximately $419 per square foot. 53 Wilbur St is a home located in Middlesex County with nearby schools including Malden High School, St Mary's School, and Malden Catholic.
Ownership History
Date
Name
Owned For
Owner Type
Purchase Details
Closed on
Sep 8, 1999
Sold by
Riordan Elizabeth A
Bought by
Tham Ca Seng and Pang Sukkie
Current Estimated Value
Home Financials for this Owner
Home Financials are based on the most recent Mortgage that was taken out on this home.
Original Mortgage
$169,200
Outstanding Balance
$49,507
Interest Rate
7.65%
Mortgage Type
Purchase Money Mortgage
Estimated Equity
$699,168
Create a Home Valuation Report for This Property
The Home Valuation Report is an in-depth analysis detailing your home's value as well as a comparison with similar homes in the area
Home Values in the Area
Average Home Value in this Area
Purchase History
| Date | Buyer | Sale Price | Title Company |
|---|---|---|---|
| Tham Ca Seng | $188,000 | -- |
Source: Public Records
Mortgage History
| Date | Status | Borrower | Loan Amount |
|---|---|---|---|
| Open | Tham Ca Seng | $169,200 | |
| Previous Owner | Tham Ca Seng | $30,000 |
Source: Public Records
Tax History Compared to Growth
Tax History
| Year | Tax Paid | Tax Assessment Tax Assessment Total Assessment is a certain percentage of the fair market value that is determined by local assessors to be the total taxable value of land and additions on the property. | Land | Improvement |
|---|---|---|---|---|
| 2025 | $70 | $618,700 | $312,500 | $306,200 |
| 2024 | $6,607 | $565,200 | $295,600 | $269,600 |
| 2023 | $6,523 | $535,100 | $270,300 | $264,800 |
| 2022 | $6,200 | $502,000 | $245,000 | $257,000 |
| 2021 | $6,420 | $522,400 | $223,800 | $298,600 |
| 2020 | $6,211 | $491,000 | $212,900 | $278,100 |
| 2019 | $5,969 | $449,800 | $202,700 | $247,100 |
| 2018 | $5,739 | $407,300 | $171,100 | $236,200 |
| 2017 | $5,593 | $394,700 | $171,100 | $223,600 |
| 2016 | $5,497 | $362,600 | $162,600 | $200,000 |
| 2015 | $5,331 | $338,900 | $153,300 | $185,600 |
| 2014 | $5,115 | $317,700 | $139,400 | $178,300 |
Source: Public Records
Map
Nearby Homes
- 26 Lanark Rd
- 73 Lanark Rd
- 0 S Mountain Avenue & O Cargil
- 46 Pagum St
- 153 Cherry St
- 40 Bratley St
- 36 Nichols Rd
- 117-119 Rockwell St
- 7 Valley St
- 68 Princeton Rd
- 31 Temple St
- 27 Temple St
- 49 Hill St
- 7 Sawyer Ct
- 26 Webber St Unit 1
- 31 Preston St
- 15 Mount Washington Ave
- 65 Beacon St
- 156 Bainbridge St
- 10 Birch Ln