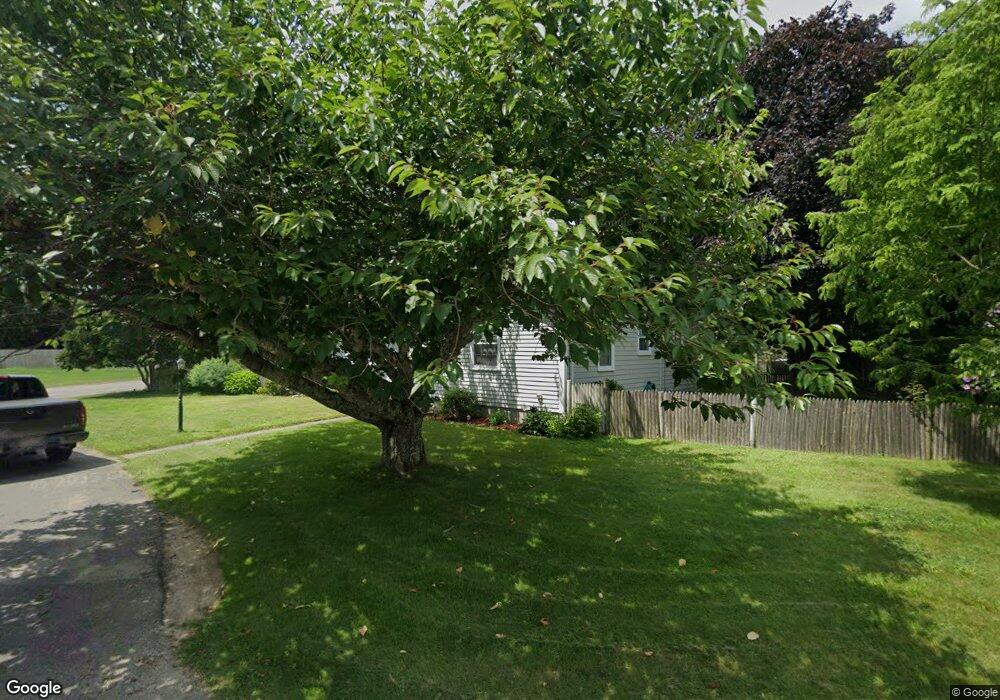
53 Wing Ln Acushnet, MA 02743
Estimated Value: $431,000 - $496,000
2
Beds
1
Bath
1,093
Sq Ft
$415/Sq Ft
Est. Value
About This Home
This home is located at 53 Wing Ln, Acushnet, MA 02743 and is currently estimated at $453,136, approximately $414 per square foot. 53 Wing Ln is a home located in Bristol County with nearby schools including Acushnet Elementary School, Albert F Ford Middle School, and Alma Del Mar Charter School.
Ownership History
Date
Name
Owned For
Owner Type
Purchase Details
Closed on
Sep 1, 2009
Sold by
Vasques Carlos M and Vasques Gabriela P
Bought by
Vasques Carlos N and Vasques Gabriela P
Current Estimated Value
Purchase Details
Closed on
Jul 5, 1991
Sold by
Luiz Frank and Luiz Amy E
Bought by
Vasques Carlos M
Create a Home Valuation Report for This Property
The Home Valuation Report is an in-depth analysis detailing your home's value as well as a comparison with similar homes in the area
Home Values in the Area
Average Home Value in this Area
Purchase History
| Date | Buyer | Sale Price | Title Company |
|---|---|---|---|
| Vasques Carlos N | -- | -- | |
| Vasques Carlos M | $105,000 | -- |
Source: Public Records
Mortgage History
| Date | Status | Borrower | Loan Amount |
|---|---|---|---|
| Closed | Vasques Carlos M | $22,000 | |
| Previous Owner | Vasques Carlos M | $10,000 | |
| Previous Owner | Vasques Carlos M | $84,000 |
Source: Public Records
Tax History
| Year | Tax Paid | Tax Assessment Tax Assessment Total Assessment is a certain percentage of the fair market value that is determined by local assessors to be the total taxable value of land and additions on the property. | Land | Improvement |
|---|---|---|---|---|
| 2025 | $39 | $362,100 | $122,100 | $240,000 |
| 2024 | $3,724 | $326,400 | $115,700 | $210,700 |
| 2023 | $3,600 | $300,000 | $104,900 | $195,100 |
| 2022 | $3,571 | $269,100 | $98,500 | $170,600 |
| 2021 | $3,452 | $249,600 | $98,500 | $151,100 |
| 2020 | $3,390 | $243,200 | $92,100 | $151,100 |
| 2019 | $3,875 | $228,800 | $87,800 | $141,000 |
| 2018 | $3,133 | $217,300 | $87,800 | $129,500 |
| 2017 | $3,230 | $209,300 | $87,800 | $121,500 |
| 2016 | $2,937 | $202,100 | $87,800 | $114,300 |
| 2015 | $2,783 | $194,900 | $87,800 | $107,100 |
Source: Public Records
Map
Nearby Homes
- 0 Hathaway Rd Unit 73469544
- 12 White St
- 14 Hayes St Unit 1
- 12 Hayes St Unit 1
- 11 Boylston St
- 91 S Main St
- 191 Hathaway Rd
- 41 Jean St
- 23 Oliveira Ave
- 112 Lawson Ave
- 25 Pershing Ave
- 20 Jake Ln
- 4 Sam St
- 44 Bernard St
- 5 William St
- 122 Truro St
- 363 Main St
- 81 Sylvia St
- 7 Deerfield Ln
- 1940-1942 Acushnet Ave
Your Personal Tour Guide
Ask me questions while you tour the home.