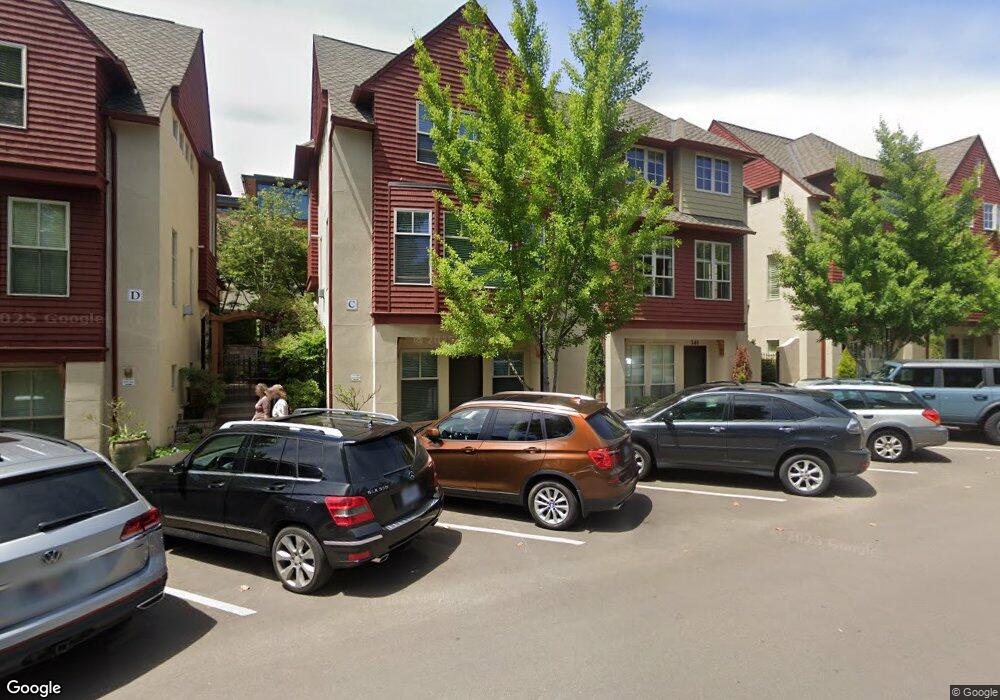
530 2nd St Lake Oswego, OR 97034
Evergreen NeighborhoodEstimated Value: $672,472 - $1,051,000
2
Beds
3
Baths
1,464
Sq Ft
$560/Sq Ft
Est. Value
About This Home
This home is located at 530 2nd St, Lake Oswego, OR 97034 and is currently estimated at $820,118, approximately $560 per square foot. 530 2nd St is a home located in Clackamas County with nearby schools including Forest Hills Elementary School, Lake Oswego Junior High School, and Lake Oswego Senior High School.
Ownership History
Date
Name
Owned For
Owner Type
Purchase Details
Closed on
Oct 28, 2008
Sold by
Lee Rosalind K
Bought by
Lee Rosalind K and The Rkl Revocable Living Trust
Current Estimated Value
Purchase Details
Closed on
Oct 4, 2006
Sold by
Stafford Commons Llc
Bought by
Lee Rosalind K
Home Financials for this Owner
Home Financials are based on the most recent Mortgage that was taken out on this home.
Original Mortgage
$331,040
Interest Rate
5.96%
Mortgage Type
Purchase Money Mortgage
Create a Home Valuation Report for This Property
The Home Valuation Report is an in-depth analysis detailing your home's value as well as a comparison with similar homes in the area
Home Values in the Area
Average Home Value in this Area
Purchase History
| Date | Buyer | Sale Price | Title Company |
|---|---|---|---|
| Lee Rosalind K | -- | None Available | |
| Lee Rosalind K | -- | Fidelity Natl Title Co Of Or |
Source: Public Records
Mortgage History
| Date | Status | Borrower | Loan Amount |
|---|---|---|---|
| Previous Owner | Lee Rosalind K | $331,040 |
Source: Public Records
Tax History Compared to Growth
Tax History
| Year | Tax Paid | Tax Assessment Tax Assessment Total Assessment is a certain percentage of the fair market value that is determined by local assessors to be the total taxable value of land and additions on the property. | Land | Improvement |
|---|---|---|---|---|
| 2025 | $7,523 | $392,618 | -- | -- |
| 2024 | $7,323 | $381,183 | -- | -- |
| 2023 | $7,323 | $370,081 | $0 | $0 |
| 2022 | $6,897 | $359,302 | $0 | $0 |
| 2021 | $6,369 | $348,837 | $0 | $0 |
| 2020 | $6,209 | $338,677 | $0 | $0 |
| 2019 | $6,057 | $328,813 | $0 | $0 |
| 2018 | $5,759 | $319,236 | $0 | $0 |
| 2017 | $5,557 | $309,938 | $0 | $0 |
| 2016 | $5,059 | $300,911 | $0 | $0 |
| 2015 | $4,887 | $292,147 | $0 | $0 |
| 2014 | $4,682 | $283,638 | $0 | $0 |
Source: Public Records
Map
Nearby Homes