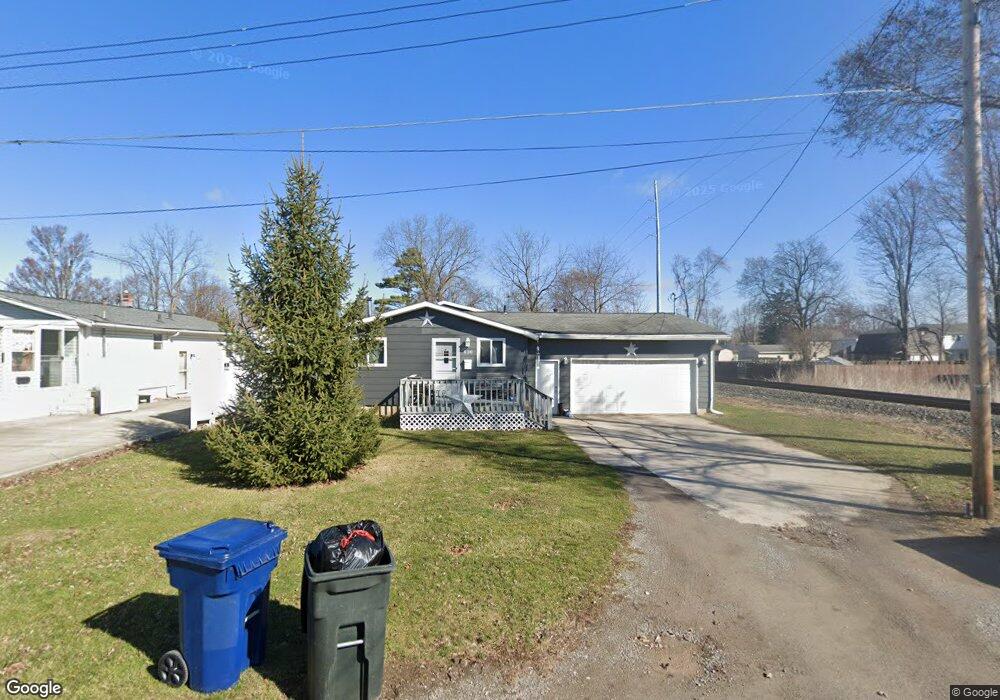
530 4th St Findlay, OH 45840
Estimated Value: $177,000 - $215,000
4
Beds
2
Baths
1,564
Sq Ft
$128/Sq Ft
Est. Value
About This Home
This home is located at 530 4th St, Findlay, OH 45840 and is currently estimated at $200,449, approximately $128 per square foot. 530 4th St is a home located in Hancock County with nearby schools including Jefferson Elementary School, Chamberlin Hill Elementary School, and Donnell Middle School.
Ownership History
Date
Name
Owned For
Owner Type
Purchase Details
Closed on
Dec 6, 2010
Sold by
Secretary Of Housing & Urban Development
Bought by
Price Nathan A
Current Estimated Value
Home Financials for this Owner
Home Financials are based on the most recent Mortgage that was taken out on this home.
Original Mortgage
$39,376
Outstanding Balance
$25,935
Interest Rate
4.16%
Mortgage Type
Construction
Estimated Equity
$174,514
Purchase Details
Closed on
Mar 24, 2010
Sold by
Fenimore Bart T and Fenimore Bart Thomas
Bought by
Citimortgage Inc
Purchase Details
Closed on
Mar 1, 2010
Sold by
Citimortgage Inc
Bought by
The Secretary Of Housing & Urban Develop
Purchase Details
Closed on
Feb 2, 1995
Sold by
Barton Leroy
Bought by
Fenimore Bart
Purchase Details
Closed on
Aug 24, 1981
Bought by
Barton Leroy B and Barton Eileen M
Create a Home Valuation Report for This Property
The Home Valuation Report is an in-depth analysis detailing your home's value as well as a comparison with similar homes in the area
Home Values in the Area
Average Home Value in this Area
Purchase History
| Date | Buyer | Sale Price | Title Company |
|---|---|---|---|
| Price Nathan A | $35,000 | Lakeside Title & Escrow Agen | |
| Citimortgage Inc | $20,000 | None Available | |
| The Secretary Of Housing & Urban Develop | -- | Attorney | |
| Fenimore Bart | $70,000 | -- | |
| Barton Leroy B | -- | -- |
Source: Public Records
Mortgage History
| Date | Status | Borrower | Loan Amount |
|---|---|---|---|
| Open | Price Nathan A | $39,376 |
Source: Public Records
Tax History
| Year | Tax Paid | Tax Assessment Tax Assessment Total Assessment is a certain percentage of the fair market value that is determined by local assessors to be the total taxable value of land and additions on the property. | Land | Improvement |
|---|---|---|---|---|
| 2024 | $2,058 | $56,470 | $5,270 | $51,200 |
| 2023 | $2,062 | $56,470 | $5,270 | $51,200 |
| 2022 | $2,055 | $56,470 | $5,270 | $51,200 |
| 2021 | $1,882 | $45,060 | $5,270 | $39,790 |
| 2020 | $1,882 | $45,060 | $5,270 | $39,790 |
| 2019 | $1,845 | $45,060 | $5,270 | $39,790 |
| 2018 | $1,763 | $39,450 | $4,800 | $34,650 |
| 2017 | $881 | $39,450 | $4,800 | $34,650 |
| 2016 | $1,742 | $39,450 | $4,800 | $34,650 |
| 2015 | $1,491 | $33,160 | $4,800 | $28,360 |
| 2014 | $1,492 | $33,160 | $4,800 | $28,360 |
| 2012 | $1,504 | $33,160 | $4,800 | $28,360 |
Source: Public Records
Map
Nearby Homes
- 731 5th St
- 206 Greenlawn Ave
- 123 Glendale Ave
- 216 1st St
- 400 E Pearl St
- 315 Fairlawn Place
- 829 Maple Ave
- 865 S Main St
- 1304 Douglas Pkwy
- 1100 Stall Dr
- 324 W Mcpherson Ave
- 1726 Eastview Dr
- 15591 Canadian Way
- 15586 Canadian Way
- 15615 Canadian Way
- 1113 Hurd Ave
- 423 Elm St
- 412 Lima Ave
- 136 E Hobart Ave
- 623 E Sandusky St
Your Personal Tour Guide
Ask me questions while you tour the home.