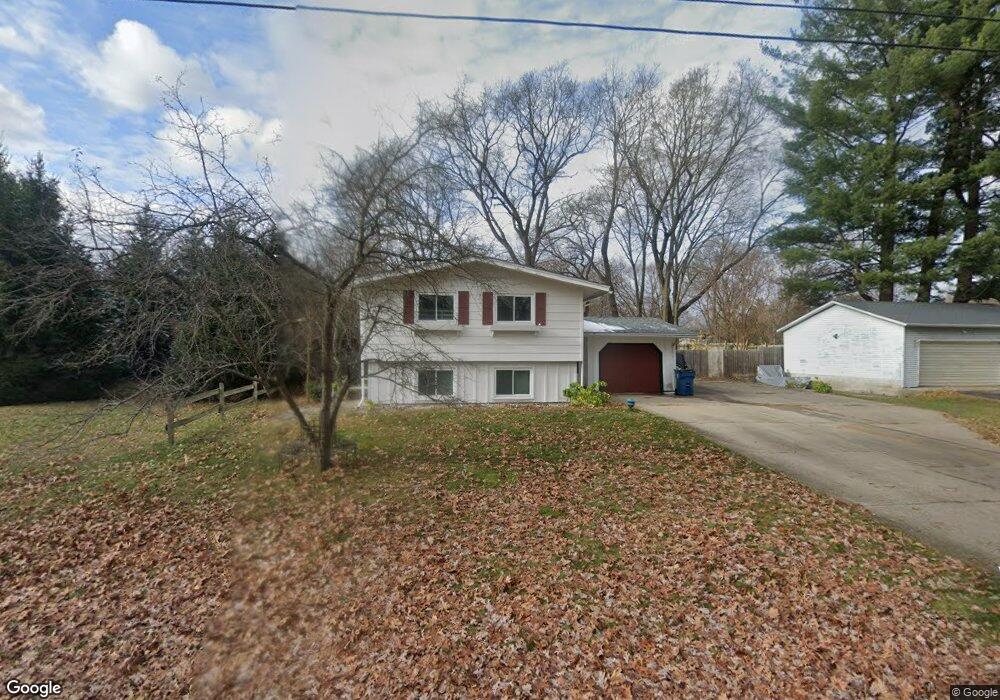
530 Academy St Allegan, MI 49010
Estimated Value: $225,000 - $248,000
3
Beds
2
Baths
1,020
Sq Ft
$235/Sq Ft
Est. Value
About This Home
This home is located at 530 Academy St, Allegan, MI 49010 and is currently estimated at $239,789, approximately $235 per square foot. 530 Academy St is a home located in Allegan County with nearby schools including West Ward Elementary School, L.E. White Middle School, and Allegan High School.
Ownership History
Date
Name
Owned For
Owner Type
Purchase Details
Closed on
Jul 9, 2021
Sold by
Rubelman Devin M and Slawson Chelsea L
Bought by
Mcferron Lindsey
Current Estimated Value
Home Financials for this Owner
Home Financials are based on the most recent Mortgage that was taken out on this home.
Original Mortgage
$156,000
Outstanding Balance
$141,675
Interest Rate
2.96%
Mortgage Type
New Conventional
Estimated Equity
$98,114
Purchase Details
Closed on
Apr 22, 2016
Sold by
Digrandi Michael
Bought by
Rubelman Devin M and Slawson Chelsea L
Home Financials for this Owner
Home Financials are based on the most recent Mortgage that was taken out on this home.
Original Mortgage
$118,251
Interest Rate
3.71%
Mortgage Type
FHA
Purchase Details
Closed on
Nov 25, 2009
Sold by
Secretary Of Housing & Urban Development
Bought by
Digrandi Michael
Home Financials for this Owner
Home Financials are based on the most recent Mortgage that was taken out on this home.
Original Mortgage
$55,000
Interest Rate
5.11%
Mortgage Type
VA
Purchase Details
Closed on
Jul 2, 2009
Sold by
Bac Home Loans Servicing Lp
Bought by
The Secretary Of Housing & Urban Develop
Purchase Details
Closed on
Dec 4, 2008
Sold by
Mortgage Electronic Registration Systems
Bought by
Countrywide Home Loans Servicing Lp
Purchase Details
Closed on
Nov 20, 2008
Sold by
Manning Pamela D
Bought by
Mortgage Electronic Registration Systems
Purchase Details
Closed on
May 9, 2005
Sold by
Manning Timothy M
Bought by
Manning Pamela D
Home Financials for this Owner
Home Financials are based on the most recent Mortgage that was taken out on this home.
Original Mortgage
$106,118
Interest Rate
5.91%
Mortgage Type
FHA
Purchase Details
Closed on
Oct 15, 1997
Sold by
Heft Marvin E and Heft Wf
Bought by
Manning Timothy and Manning Pamela
Create a Home Valuation Report for This Property
The Home Valuation Report is an in-depth analysis detailing your home's value as well as a comparison with similar homes in the area
Home Values in the Area
Average Home Value in this Area
Purchase History
| Date | Buyer | Sale Price | Title Company |
|---|---|---|---|
| Mcferron Lindsey | $195,000 | Ata National Title Group Llc | |
| Mcferron Lindsey | $195,000 | Ata National Title Group | |
| Rubelman Devin M | $115,000 | Star Title Agency Llc | |
| Digrandi Michael | $55,000 | Chicago Title | |
| The Secretary Of Housing & Urban Develop | -- | None Available | |
| Countrywide Home Loans Servicing Lp | -- | None Available | |
| Mortgage Electronic Registration Systems | $129,315 | None Available | |
| Manning Pamela D | -- | Unified Title | |
| Manning Timothy | $86,000 | -- |
Source: Public Records
Mortgage History
| Date | Status | Borrower | Loan Amount |
|---|---|---|---|
| Open | Mcferron Lindsey | $156,000 | |
| Closed | Mcferron Lindsey | $156,000 | |
| Previous Owner | Rubelman Devin M | $118,251 | |
| Previous Owner | Digrandi Michael | $55,000 | |
| Previous Owner | Manning Pamela D | $106,118 |
Source: Public Records
Tax History Compared to Growth
Tax History
| Year | Tax Paid | Tax Assessment Tax Assessment Total Assessment is a certain percentage of the fair market value that is determined by local assessors to be the total taxable value of land and additions on the property. | Land | Improvement |
|---|---|---|---|---|
| 2025 | $3,156 | $91,000 | $18,100 | $72,900 |
| 2024 | $2,872 | $88,100 | $17,300 | $70,800 |
| 2023 | $2,976 | $75,500 | $16,200 | $59,300 |
| 2022 | $2,872 | $63,800 | $13,700 | $50,100 |
| 2021 | $2,272 | $59,200 | $10,800 | $48,400 |
| 2020 | $2,239 | $61,500 | $9,000 | $52,500 |
| 2019 | $2,184 | $54,400 | $8,100 | $46,300 |
| 2018 | $2,098 | $50,900 | $7,900 | $43,000 |
| 2017 | $0 | $47,300 | $6,600 | $40,700 |
| 2016 | $0 | $42,600 | $0 | $0 |
| 2015 | -- | $0 | $0 | $0 |
| 2014 | -- | $40,800 | $5,500 | $35,300 |
| 2013 | $2,203 | $42,400 | $5,500 | $36,900 |
Source: Public Records
Map
Nearby Homes