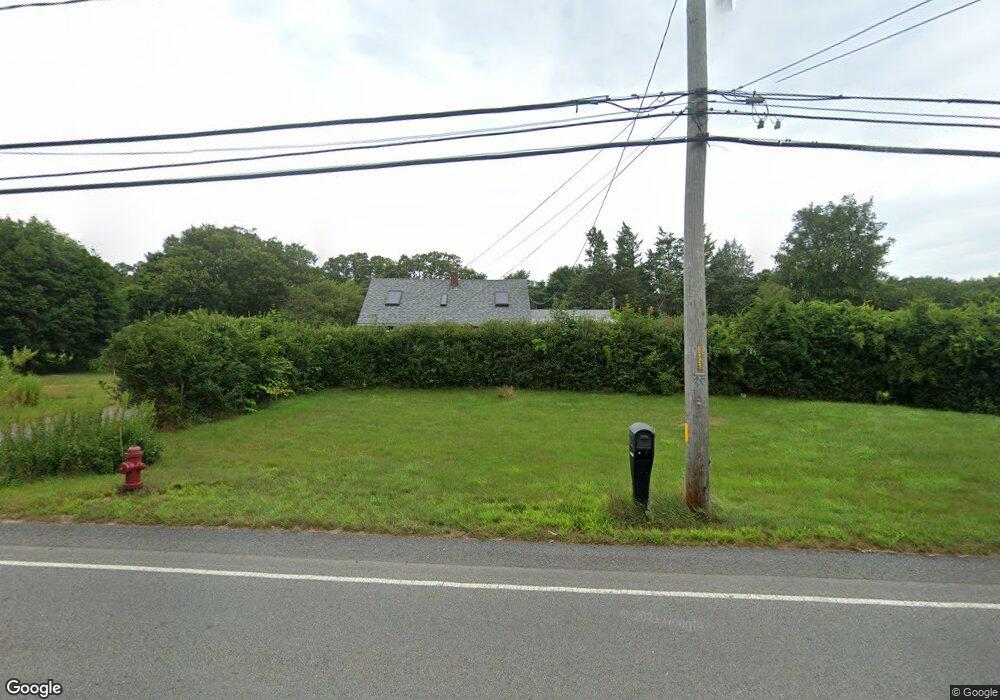
530 Chase Rd North Dartmouth, MA 02747
Estimated Value: $385,000 - $508,000
2
Beds
1
Bath
941
Sq Ft
$482/Sq Ft
Est. Value
About This Home
This home is located at 530 Chase Rd, North Dartmouth, MA 02747 and is currently estimated at $453,362, approximately $481 per square foot. 530 Chase Rd is a home located in Bristol County with nearby schools including Dartmouth High School.
Ownership History
Date
Name
Owned For
Owner Type
Purchase Details
Closed on
Dec 16, 2014
Sold by
Travers Frank J
Bought by
Travers Frank J and Travers Ashley M
Current Estimated Value
Home Financials for this Owner
Home Financials are based on the most recent Mortgage that was taken out on this home.
Original Mortgage
$152,500
Outstanding Balance
$117,072
Interest Rate
3.98%
Mortgage Type
New Conventional
Estimated Equity
$336,290
Purchase Details
Closed on
Apr 18, 2014
Sold by
Travers Sheila M
Bought by
Travers Frank J
Home Financials for this Owner
Home Financials are based on the most recent Mortgage that was taken out on this home.
Original Mortgage
$147,283
Interest Rate
4.5%
Mortgage Type
FHA
Purchase Details
Closed on
Jun 30, 2003
Sold by
Travers Frank M and Travers Sheila M
Bought by
Travers Sheila M
Create a Home Valuation Report for This Property
The Home Valuation Report is an in-depth analysis detailing your home's value as well as a comparison with similar homes in the area
Home Values in the Area
Average Home Value in this Area
Purchase History
| Date | Buyer | Sale Price | Title Company |
|---|---|---|---|
| Travers Frank J | -- | -- | |
| Travers Frank J | $150,000 | -- | |
| Travers Sheila M | -- | -- |
Source: Public Records
Mortgage History
| Date | Status | Borrower | Loan Amount |
|---|---|---|---|
| Open | Travers Frank J | $152,500 | |
| Previous Owner | Travers Frank J | $147,283 | |
| Previous Owner | Travers Sheila M | $143,001 | |
| Previous Owner | Travers Sheila M | $101,500 |
Source: Public Records
Tax History Compared to Growth
Tax History
| Year | Tax Paid | Tax Assessment Tax Assessment Total Assessment is a certain percentage of the fair market value that is determined by local assessors to be the total taxable value of land and additions on the property. | Land | Improvement |
|---|---|---|---|---|
| 2025 | $3,441 | $373,200 | $212,900 | $160,300 |
| 2024 | $3,387 | $365,800 | $210,200 | $155,600 |
| 2023 | $3,348 | $338,200 | $194,800 | $143,400 |
| 2022 | $3,423 | $318,400 | $194,800 | $123,600 |
| 2021 | $2,811 | $252,800 | $189,200 | $63,600 |
| 2020 | $2,454 | $219,500 | $160,200 | $59,300 |
| 2019 | $2,340 | $209,900 | $150,600 | $59,300 |
| 2018 | $3,970 | $206,300 | $154,400 | $51,900 |
| 2017 | $2,131 | $195,900 | $145,500 | $50,400 |
| 2016 | $2,096 | $190,200 | $139,700 | $50,500 |
| 2015 | $1,918 | $174,400 | $122,700 | $51,700 |
| 2014 | $1,920 | $173,900 | $122,800 | $51,100 |
Source: Public Records
Map
Nearby Homes
- 14 Westview Dr
- 10 Westview Dr
- 219 Chase Rd
- 34 Country Way
- 1150 Russells Mills Rd
- 360 Russells Mills Rd
- 75 Country Way Unit 75
- 24 Wayne Memorial Dr
- 248 Bakerville Rd
- 5 Samosett Dr
- 3 Mishawum Dr
- Lot 6 Rafael Rd
- 1004 Allen St
- 6 Strathmore Rd
- 6 Jacob Dr
- 73 White Oak Run
- 312 Old Westport Rd
- 320 Old Westport Rd
- 310 Old Westport Rd
- 53 Morton Ave