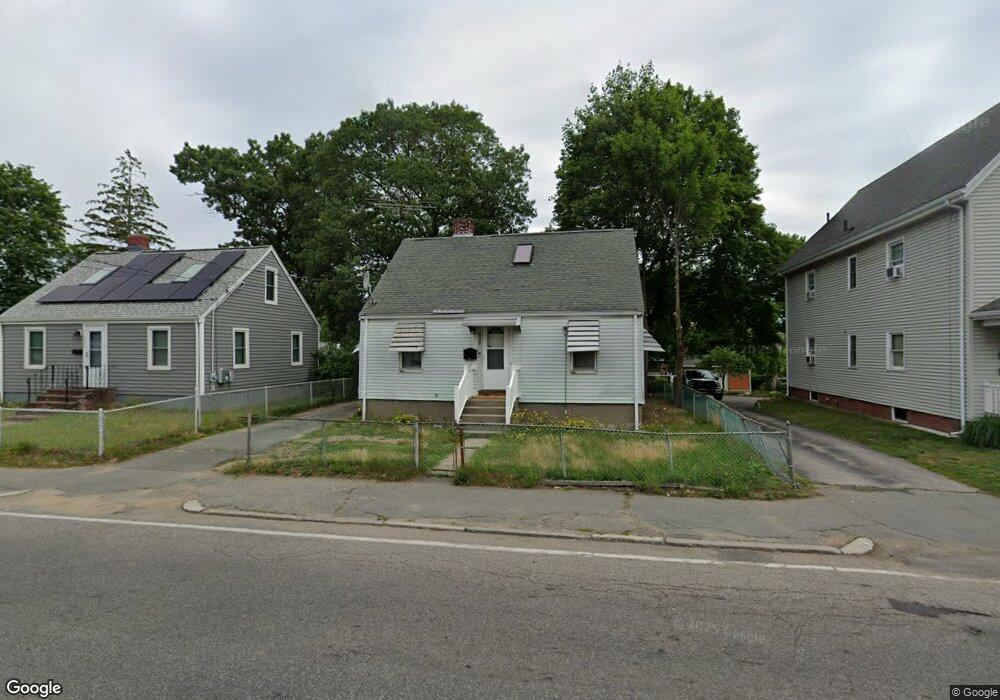
530 Crescent St Brockton, MA 02302
Estimated Value: $342,000 - $436,000
2
Beds
1
Bath
696
Sq Ft
$554/Sq Ft
Est. Value
About This Home
This home is located at 530 Crescent St, Brockton, MA 02302 and is currently estimated at $385,291, approximately $553 per square foot. 530 Crescent St is a home located in Plymouth County with nearby schools including Brookfield Elementary School, Downey Elementary School, and Ashfield Middle School.
Ownership History
Date
Name
Owned For
Owner Type
Purchase Details
Closed on
Apr 27, 2023
Sold by
Somario Stephen
Bought by
Rodriguez Alex G
Current Estimated Value
Home Financials for this Owner
Home Financials are based on the most recent Mortgage that was taken out on this home.
Original Mortgage
$261,850
Outstanding Balance
$254,300
Interest Rate
6.6%
Mortgage Type
Purchase Money Mortgage
Estimated Equity
$130,991
Purchase Details
Closed on
Aug 22, 2008
Sold by
Deutsche Bank Natl T C
Bought by
Somario Stephen
Purchase Details
Closed on
Jul 30, 2008
Sold by
Pina Leonardo M
Bought by
Deutsche Bank Natl T C
Purchase Details
Closed on
Oct 5, 2006
Sold by
Mcpherson Eric
Bought by
Pina Leonardo M
Purchase Details
Closed on
Nov 16, 2000
Sold by
Department Of Housing & Urban Dev and Citiwest New England
Bought by
Mcpherson Eric
Home Financials for this Owner
Home Financials are based on the most recent Mortgage that was taken out on this home.
Original Mortgage
$48,000
Interest Rate
7.78%
Mortgage Type
Purchase Money Mortgage
Purchase Details
Closed on
Sep 30, 1997
Sold by
Walls Elvis C and Walls Lorraine G
Bought by
Dennis Gene and Dennis Gina L
Home Financials for this Owner
Home Financials are based on the most recent Mortgage that was taken out on this home.
Original Mortgage
$11,024
Interest Rate
7.19%
Create a Home Valuation Report for This Property
The Home Valuation Report is an in-depth analysis detailing your home's value as well as a comparison with similar homes in the area
Home Values in the Area
Average Home Value in this Area
Purchase History
| Date | Buyer | Sale Price | Title Company |
|---|---|---|---|
| Rodriguez Alex G | $275,000 | None Available | |
| Somario Stephen | $76,000 | -- | |
| Somario Stephen | $76,000 | -- | |
| Deutsche Bank Natl T C | $108,375 | -- | |
| Deutsche Bank Natl T C | $108,375 | -- | |
| Pina Leonardo M | $220,000 | -- | |
| Pina Leonardo M | $220,000 | -- | |
| Mcpherson Eric | $96,000 | -- | |
| Dennis Gene | $60,000 | -- | |
| Dennis Gene | $60,000 | -- |
Source: Public Records
Mortgage History
| Date | Status | Borrower | Loan Amount |
|---|---|---|---|
| Open | Rodriguez Alex G | $261,850 | |
| Previous Owner | Dennis Gene | $48,000 | |
| Previous Owner | Dennis Gene | $11,024 | |
| Previous Owner | Dennis Gene | $54,653 |
Source: Public Records
Tax History Compared to Growth
Tax History
| Year | Tax Paid | Tax Assessment Tax Assessment Total Assessment is a certain percentage of the fair market value that is determined by local assessors to be the total taxable value of land and additions on the property. | Land | Improvement |
|---|---|---|---|---|
| 2025 | $3,861 | $318,800 | $133,800 | $185,000 |
| 2024 | $3,806 | $316,600 | $133,800 | $182,800 |
| 2023 | $3,633 | $279,900 | $100,700 | $179,200 |
| 2022 | $3,494 | $250,100 | $91,200 | $158,900 |
| 2021 | $3,323 | $229,200 | $75,200 | $154,000 |
| 2020 | $3,065 | $202,300 | $71,200 | $131,100 |
| 2019 | $3,016 | $194,100 | $68,400 | $125,700 |
| 2018 | $2,835 | $176,500 | $68,400 | $108,100 |
| 2017 | $2,297 | $142,700 | $68,400 | $74,300 |
| 2016 | $2,125 | $122,400 | $66,200 | $56,200 |
| 2015 | $1,911 | $105,300 | $66,200 | $39,100 |
| 2014 | $1,878 | $103,600 | $66,200 | $37,400 |
Source: Public Records
Map
Nearby Homes
- 526 Crescent St
- 538 Crescent St
- 116 Hill St
- 540 Crescent St
- 26 Kight Crescent St
- 110 Hill St
- 0 Jacob St
- 527 Crescent St
- 112 Hill St
- 121 Massasoit Ave
- 531 Crescent St
- 514 Crescent St
- 537 Crescent St
- 519 Crescent St
- 525 Crescent St
- 542 Crescent St
- 6 Jacob St
- 2 Jacob St
- 2 Jacob St Unit 1
- 115 Massasoit Ave