530 Cypress Rd Newington, CT 06111
Estimated Value: $245,405 - $282,000
2
Beds
2
Baths
1,162
Sq Ft
$229/Sq Ft
Est. Value
About This Home
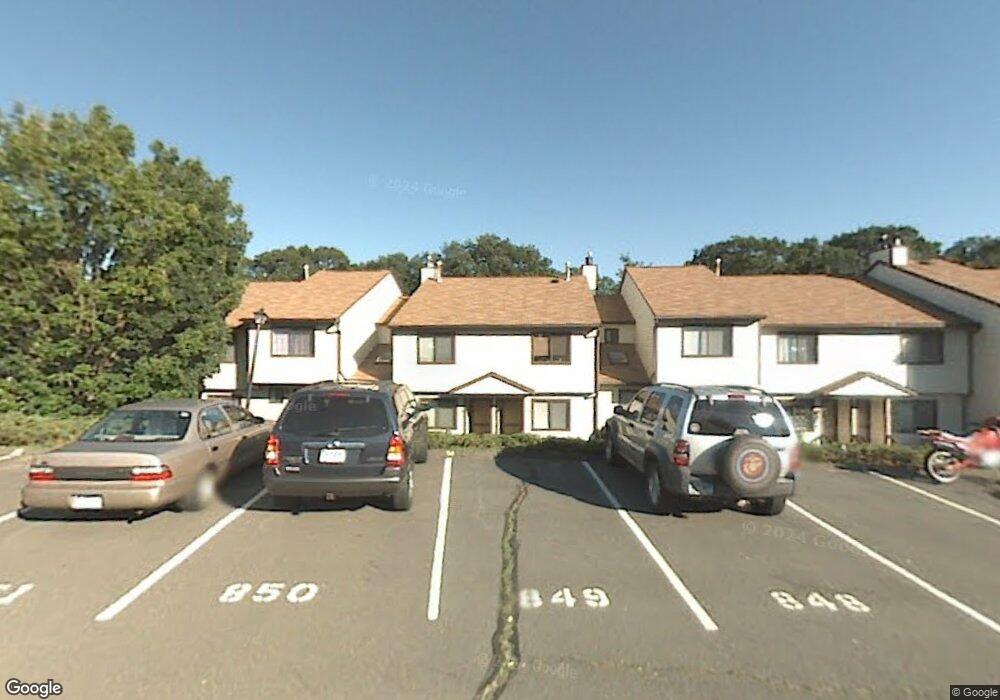
This home is located at 530 Cypress Rd, Newington, CT 06111 and is currently estimated at $265,601, approximately $228 per square foot. 530 Cypress Rd is a home located in Hartford County with nearby schools including Ruth Chaffee School, John Wallace Middle School, and Newington High School.
Ownership History
Date
Name
Owned For
Owner Type
Purchase Details
Closed on
Jan 3, 2017
Sold by
Cosma Gheorghe
Bought by
Vojnich Denise E
Current Estimated Value
Home Financials for this Owner
Home Financials are based on the most recent Mortgage that was taken out on this home.
Original Mortgage
$110,400
Outstanding Balance
$90,282
Interest Rate
3.94%
Mortgage Type
Purchase Money Mortgage
Estimated Equity
$175,319
Purchase Details
Closed on
Dec 31, 2015
Sold by
Stonge Jennifer
Bought by
Fnma
Purchase Details
Closed on
May 27, 2008
Sold by
Grogoza Richard
Bought by
Grenier Jennifer
Home Financials for this Owner
Home Financials are based on the most recent Mortgage that was taken out on this home.
Original Mortgage
$157,800
Interest Rate
5.94%
Purchase Details
Closed on
Jul 1, 2002
Sold by
Hollfelder Richard
Bought by
Grogoza Richard
Purchase Details
Closed on
Jan 19, 2001
Sold by
Stanulis Paul A
Bought by
Hollfelder Richard
Create a Home Valuation Report for This Property
The Home Valuation Report is an in-depth analysis detailing your home's value as well as a comparison with similar homes in the area
Home Values in the Area
Average Home Value in this Area
Purchase History
| Date | Buyer | Sale Price | Title Company |
|---|---|---|---|
| Vojnich Denise E | $138,000 | -- | |
| Vojnich Denise E | $138,000 | -- | |
| Fnma | -- | -- | |
| Fnma | -- | -- | |
| Grenier Jennifer | $166,152 | -- | |
| Grenier Jennifer | $166,152 | -- | |
| Grogoza Richard | $116,000 | -- | |
| Grogoza Richard | $116,000 | -- | |
| Hollfelder Richard | $85,000 | -- | |
| Hollfelder Richard | $85,000 | -- |
Source: Public Records
Mortgage History
| Date | Status | Borrower | Loan Amount |
|---|---|---|---|
| Open | Vojnich Denise E | $110,400 | |
| Closed | Hollfelder Richard | $110,400 | |
| Previous Owner | Hollfelder Richard | $157,800 |
Source: Public Records
Tax History Compared to Growth
Tax History
| Year | Tax Paid | Tax Assessment Tax Assessment Total Assessment is a certain percentage of the fair market value that is determined by local assessors to be the total taxable value of land and additions on the property. | Land | Improvement |
|---|---|---|---|---|
| 2025 | $3,800 | $95,050 | $0 | $95,050 |
| 2024 | $3,771 | $95,050 | $0 | $95,050 |
| 2023 | $3,646 | $95,050 | $0 | $95,050 |
| 2022 | $3,658 | $95,050 | $0 | $95,050 |
| 2021 | $3,689 | $95,050 | $0 | $95,050 |
| 2020 | $4,048 | $103,050 | $0 | $103,050 |
| 2019 | $4,065 | $103,050 | $0 | $103,050 |
| 2018 | $3,967 | $103,050 | $0 | $103,050 |
| 2017 | $3,771 | $103,050 | $0 | $103,050 |
| 2016 | $3,684 | $103,050 | $0 | $103,050 |
| 2015 | $3,721 | $103,930 | $0 | $103,930 |
| 2014 | $3,614 | $103,930 | $0 | $103,930 |
Source: Public Records
Map
Nearby Homes
- 155 Cottonwood Rd
- 122 Cottonwood Rd Unit 122
- 265 Back Ln
- 98 Crown Ridge
- 15 Woodsedge Dr Unit 6C
- 15 Woodsedge Dr Unit 4B
- 61 Luca Ln
- 67 Luca (Homesite 6) Ln
- 53 Luca (Homesite 4) Ln
- 76 Luca Lane Homesite 8
- 35 Woodsedge Dr Unit 4C
- 8 Stella Dr
- 263 Two Rod Hwy
- 92 Timothy St
- 5 Robeth Ln
- 64 Kenlock St
- 18 Stone Hill Dr
- 155 Old Common Rd
- 42 Rose Ct
- 120 Fox Run Ct
- 530 Cypress Rd Unit 530
- 518 Cypress Rd
- 518 Cypress Rd Unit 518
- 532 Cypress Rd
- 532 Cypress Rd
- 532 Cypress Rd Unit 532
- 520 Cypress Rd
- 534 Cypress Rd
- 534 Cypress Rd Unit 534
- 534 Cypress Rd Unit 31
- 522 Cypress Rd
- 522 Cypress Rd Unit 522
- 442 Cypress Rd
- 528 Cypress Rd
- 442 Cypress Rd Unit 442
- 536 Cypress Rd
- 524 Cypress Rd
- 524 Cypress Rd Unit 524
- 446 Cypress Rd
- 446 Cypress Rd Unit 446